Snapshot of outcomes related to the HCPC’s education function for the 2017-18 academic year
The data set
The education annual data set includes data the following areas of our work:
- Approved programmes at academic year end
- Approval process
- Major change process
- Annual monitoring process
- Concerns process
All figures gathered relate to work where we carried out an assessment of a programme in the 2017–18 academic year. Where outcomes were finalised in the following academic year, we've included these in the data set due to the timing of the assessments being carried out.
Most sources of data count assessments carried out on an individual programme basis (rather than at case level).
Approved programmes at academic year end
This year, we saw a 7 per cent increase in new programmes, factoring in programme closures. This is an increase compared to the previous three years. This is in contrast to the average increase seen over the previous three years.
Changes in approved programme numbers between years:
| 2014-15 | 2.6% |
| 2015-16 | 2.2% |
| 2016-17 | 0.9% |
| 2017-18 | 7.3% |
There are many factors driving this growth in programmes, some dependent on developments within professions, whilst others cut across all professions. Further analysis of new programme generation is included within the approval process section.
However, key developments influencing this result include:
- degree apprenticeships in England;
- diversification of higher education provision through regulatory / policy changes in England and
- medicines entitlements changes for some professions
Approval process
Reasons for visiting programmes
We visited programmes from 12 of the 16 professions we regulate. Of the 12, the top four professions are highlighted in the graph below. The graph reflects broader trends across a number of professions, leading to new programmes and significant changes to existing programmes.
Number of programmes visited, by profession and reason for visit (top 4)
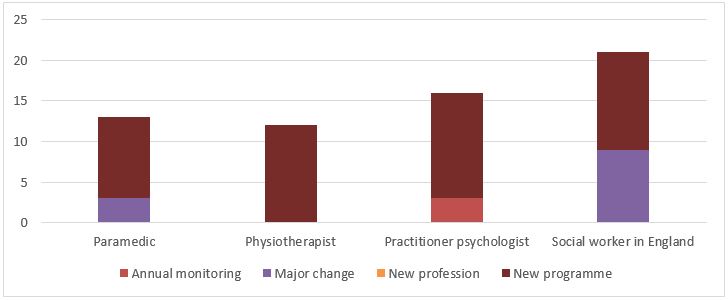
New social work programmes were mostly related to postgraduate provision. We are familiar with regular funding provided to support this area of training, so this result is expected, particularly where new providers are awarded contracts to deliver this training.
There continues to be a high number of new programme approvals for paramedic and practitioner psychologist programmes, a trend which continues on from the previous period. For paramedics, all new programmes were degree-level training, in keeping with our requirements for the revised threshold for this profession which will come into effect in September 2021*.
* Threshold level of qualification for entry to the Register for paramedics
Changes in commissioning for allied health professions led to new education providers seeking to deliver physiotherapy programmes. We expect this trend to continue across all professions in future years.
It is unclear why there continue to be more new practitioner psychologist programmes than expected, with new programmes being assessed for six different education providers (relating particularly to counselling, educational, forensic and health psychologist training), as there appear to be no obvious sources of new funding. It may be that education providers are responding to market and workforce needs, although we have no further data available to support this.
Time taken to complete the approval process
We aim to complete the post-visit process within three months of the visit concluding. This year, 31 per cent of programmes completed the process within this timeframe, which is broadly consistent with the previous year. The majority of programmes completed the process within a four-month timeframe (85 per cent), repeating the outcome from last year.
Average time between visit date and conditions deadline
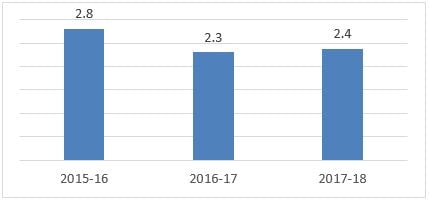
This is mainly because education providers need on average 2.4 months to provide their first response, if we place any conditions on a programme’s approval. This continues a trend we have seen in recent years, whereby the number and complexity of conditions we place on approval directly affect how long it takes for education providers to reach a final outcome. Despite this, we have continued to produce visitors’ reports consistently within our 28-day target, averaging 25 days to produce these.
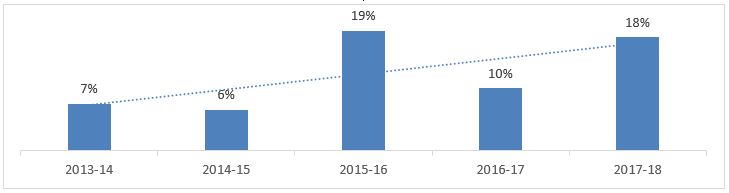
Cancelled visits
Since 2015–16, we have seen a higher occurrence of cancelled visits. This year we also had an 11 per cent increase in programmes withdrawn at visit or after visit had taken place. This usually occurs when the education provider has decided not to meet conditions we have placed on approval.
Percentage of visits cancelled
Major change process
While the number of major change notifications we received remained consistent with last year (as a proportion of all approved programmes), we referred fewer to our approval process for assessment.
Major changes we referred to the approval process
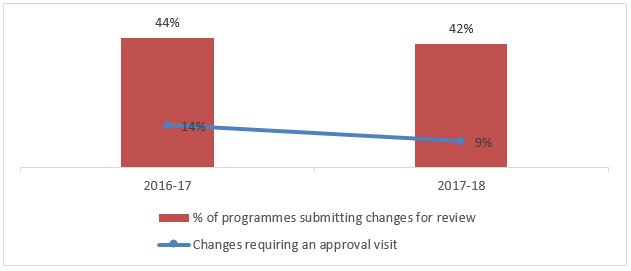
We adjusted the way we assess degree apprenticeship programmes in 2017–18 so that more changes to approved programmes could be considered via the major change process**. This should help us to better identify changes that require an approval visit. It may have contributed to the slight decrease in referrals to our approval process compared to last year.
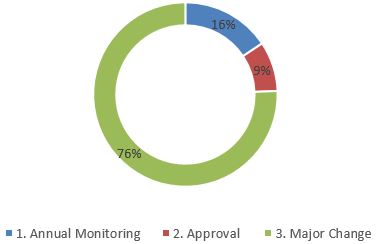
We referred almost 91 per cent of all other changes to our major change and annual monitoring processes (as illustrated in the graph below).
Executive recommendations made regarding change notifications
** Education and Training Committee meeting, 7 March 2018
Time taken to complete notification and full major change process
We exceeded our notification stage timescale for providing outcomes to education providers. We will continue to monitor this area of the process to identify any areas where we can be more efficient.
Because recent changes have been complex, we have had to engage more with education providers to understand the impact to standards and the best process to use to assess any changes, which is a likely factor influencing this result.
Annual monitoring process
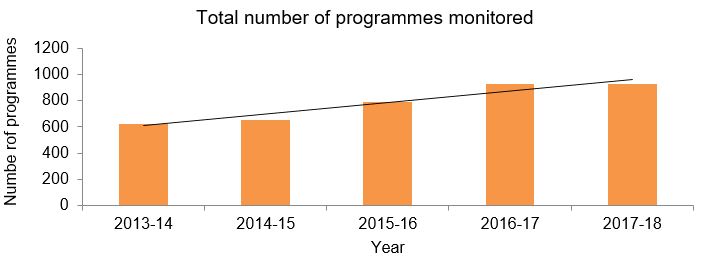
While the number of programmes being monitored has increased since 2013–14, it has stabilised over the last two years. This is consistent with the steady number of overall approved programmes during this period.
We can expect the small increase in approved programmes this year to affect annual monitoring in two years’ time, when these programmes go through this process for the first time.
When we require additional documentation to be submitted
Audit submission – standards met at first attempt
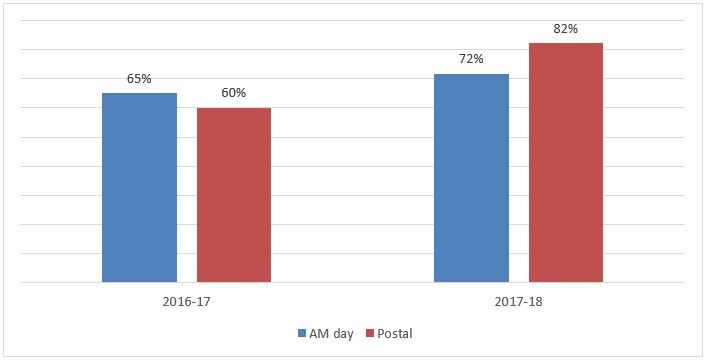
In the past, we have seen a disparity in outcomes of the annual monitoring process, based on whether we were assessing programmes in person or via post.
Over the past two years, we have worked to address this with further training and guidance for both employees and visitors, and more effective back office systems. We have managed to achieve consistency between assessment methods. In particular, the understanding of our service user and carer requirement, which visitors had historically needed to request further documentation for, appears to have improved.
This has meant a higher proportion of programmes have met our standards at their first attempt this year. We expect challenges next year with our assessment of the revised standards, which include the introduction of new education standards and significant changes to existing ones. We are already working to prepare education providers appropriately.
Programme concerns process
Year |
No of programmes |
% of all approved programmes |
| 2014-15 | 5 | 0.5% |
| 2015-16 | 6 | 0.6% |
| 2016-17 | 9 | 0.8% |
| 2107-18 | 10 | 0.9% |
The number of programmes subject to a concern being raised and investigated continue to remain low.
Where the process is started, it appears to be effective in allowing a range of outcomes. In this period we investigated three concerns fully, with two referred to annual monitoring, and one requiring no further action.
We changed our approach so that we seek to resolve quality assurance issues within the concerns process itself, rather than referring them to another process. Our results this year indicate this is effective.
- Published:
- 26/09/2019
- Resources
- Report, Data
- Subcategory:
- Education data