We have provided key statistics as a summary of the picture of education and training for the professions we regulate, and how that picture is changing.
Number of approved pre-registration programmes
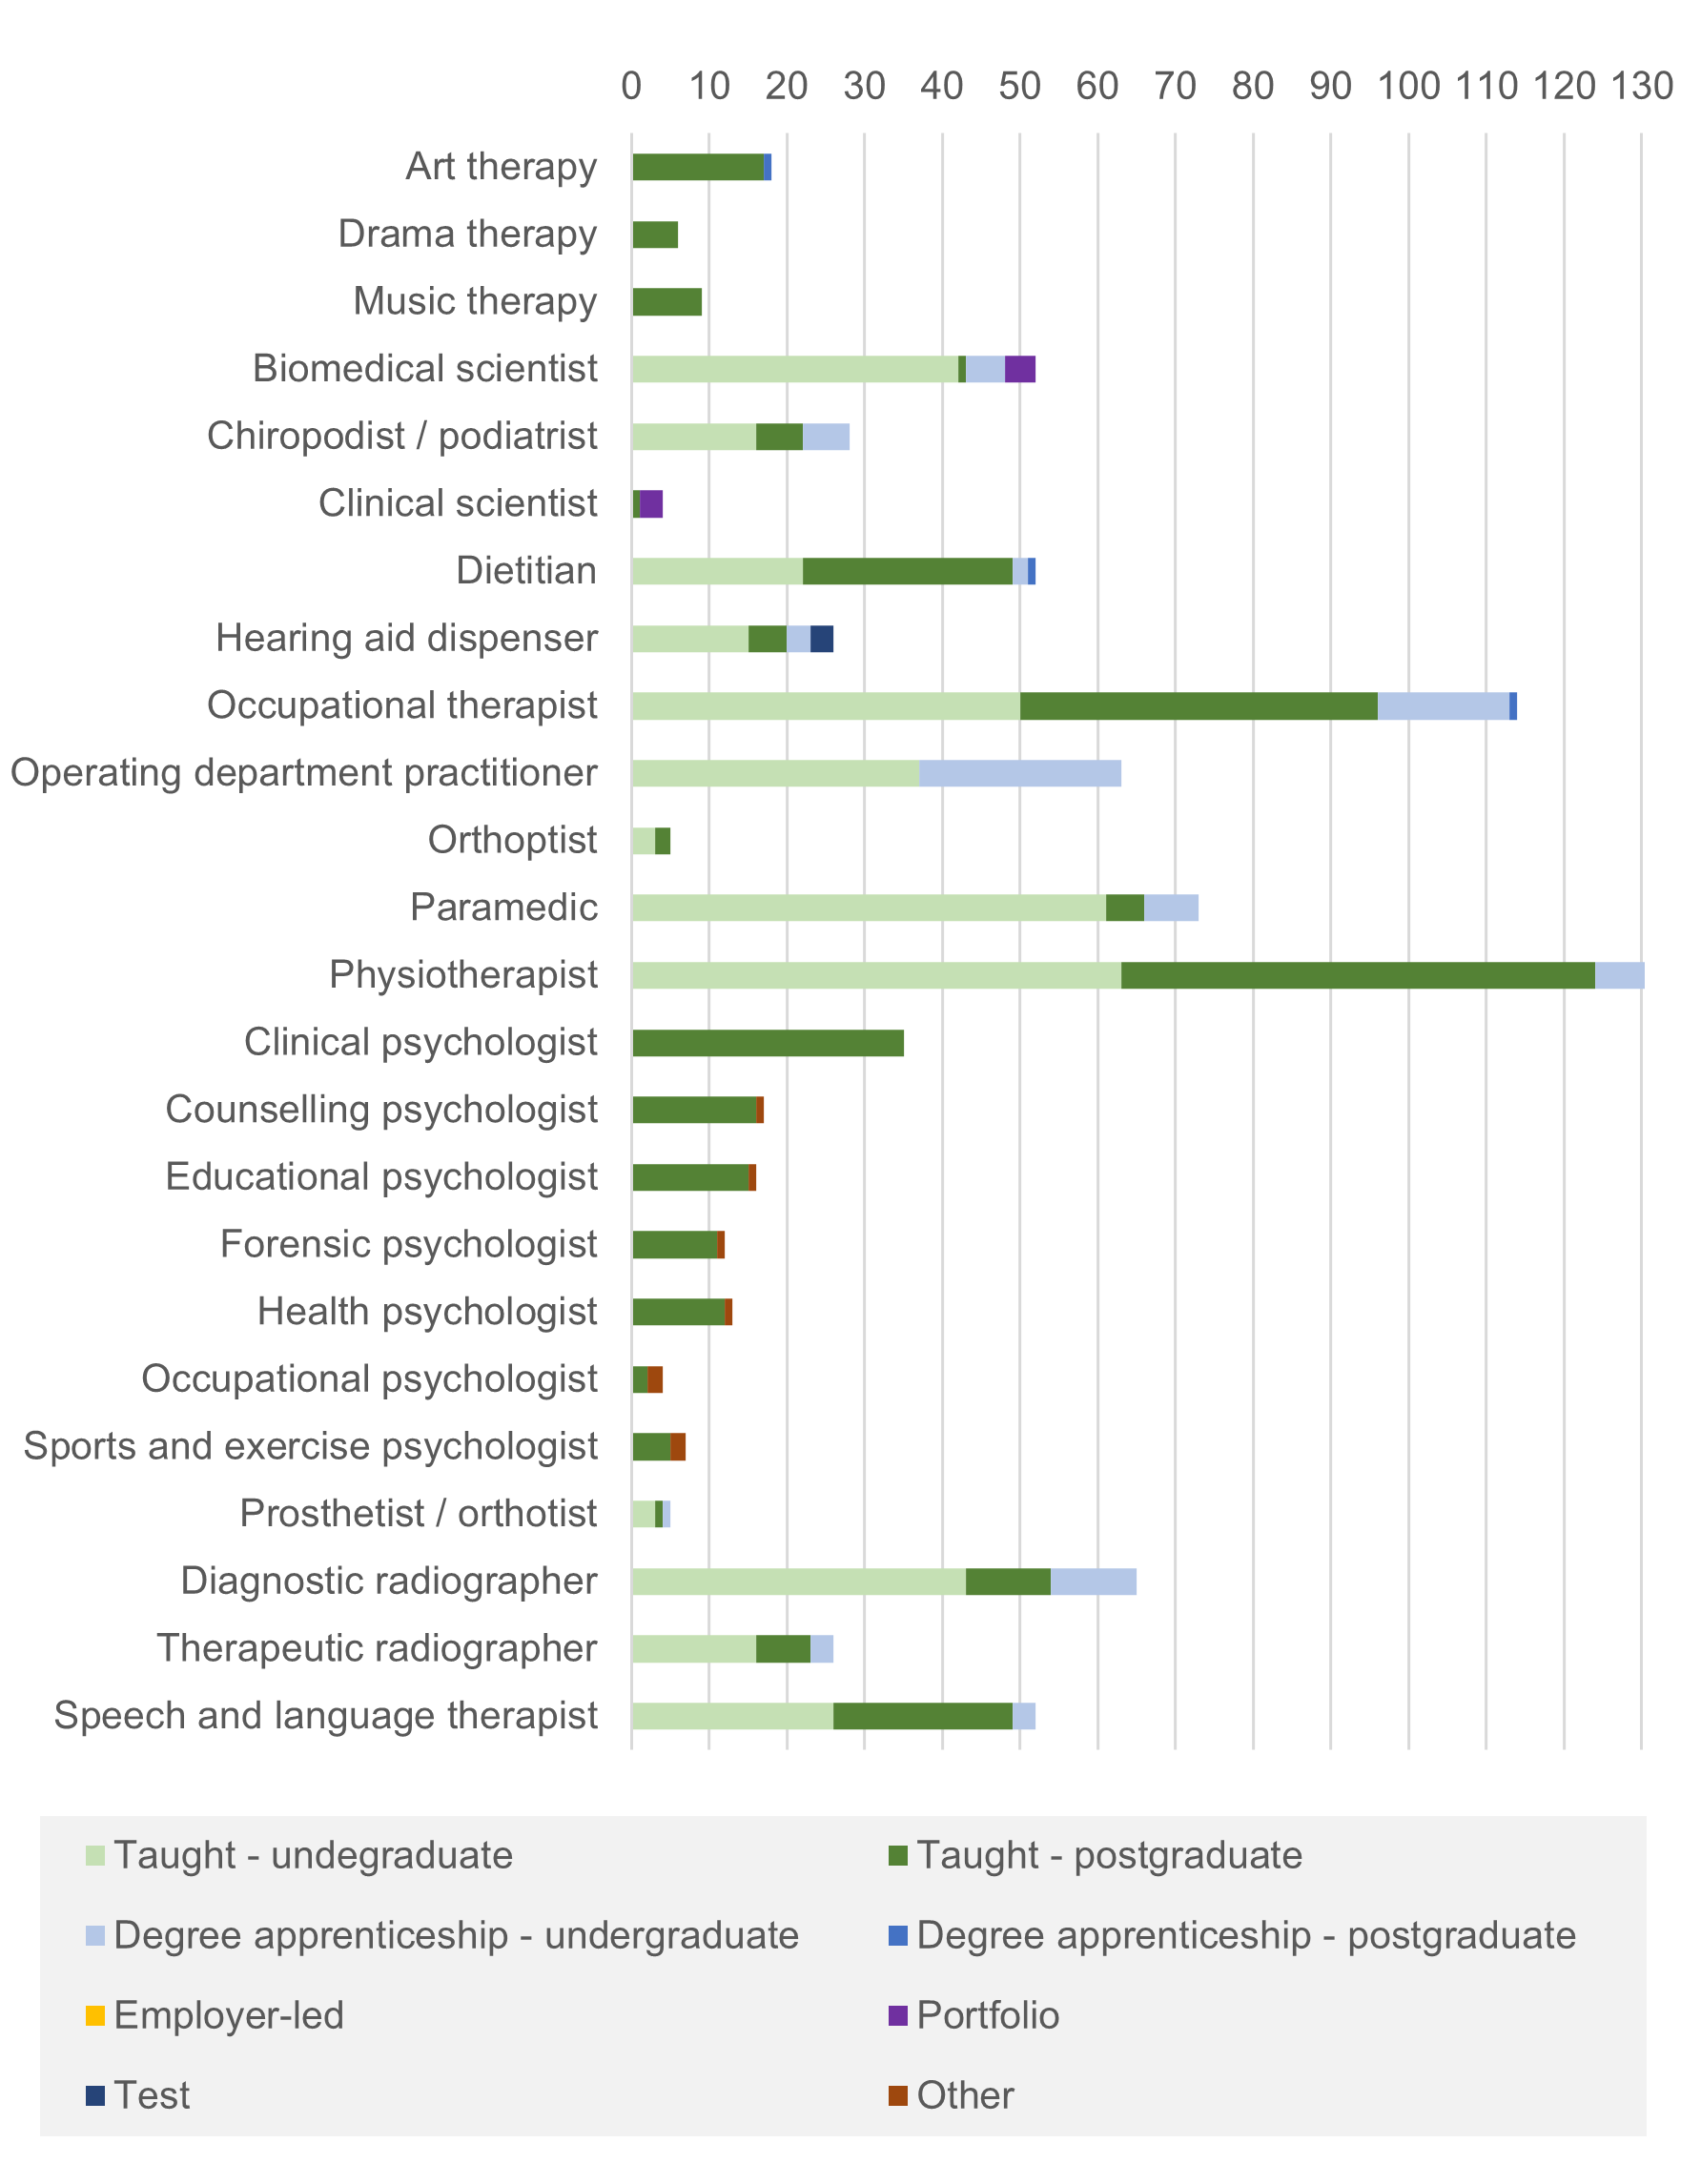
We have seen a growth in the overall number of programmes in the 2024-25 academic year by a total of 57 programmes (7% growth overall). Some professions have grown more significantly:
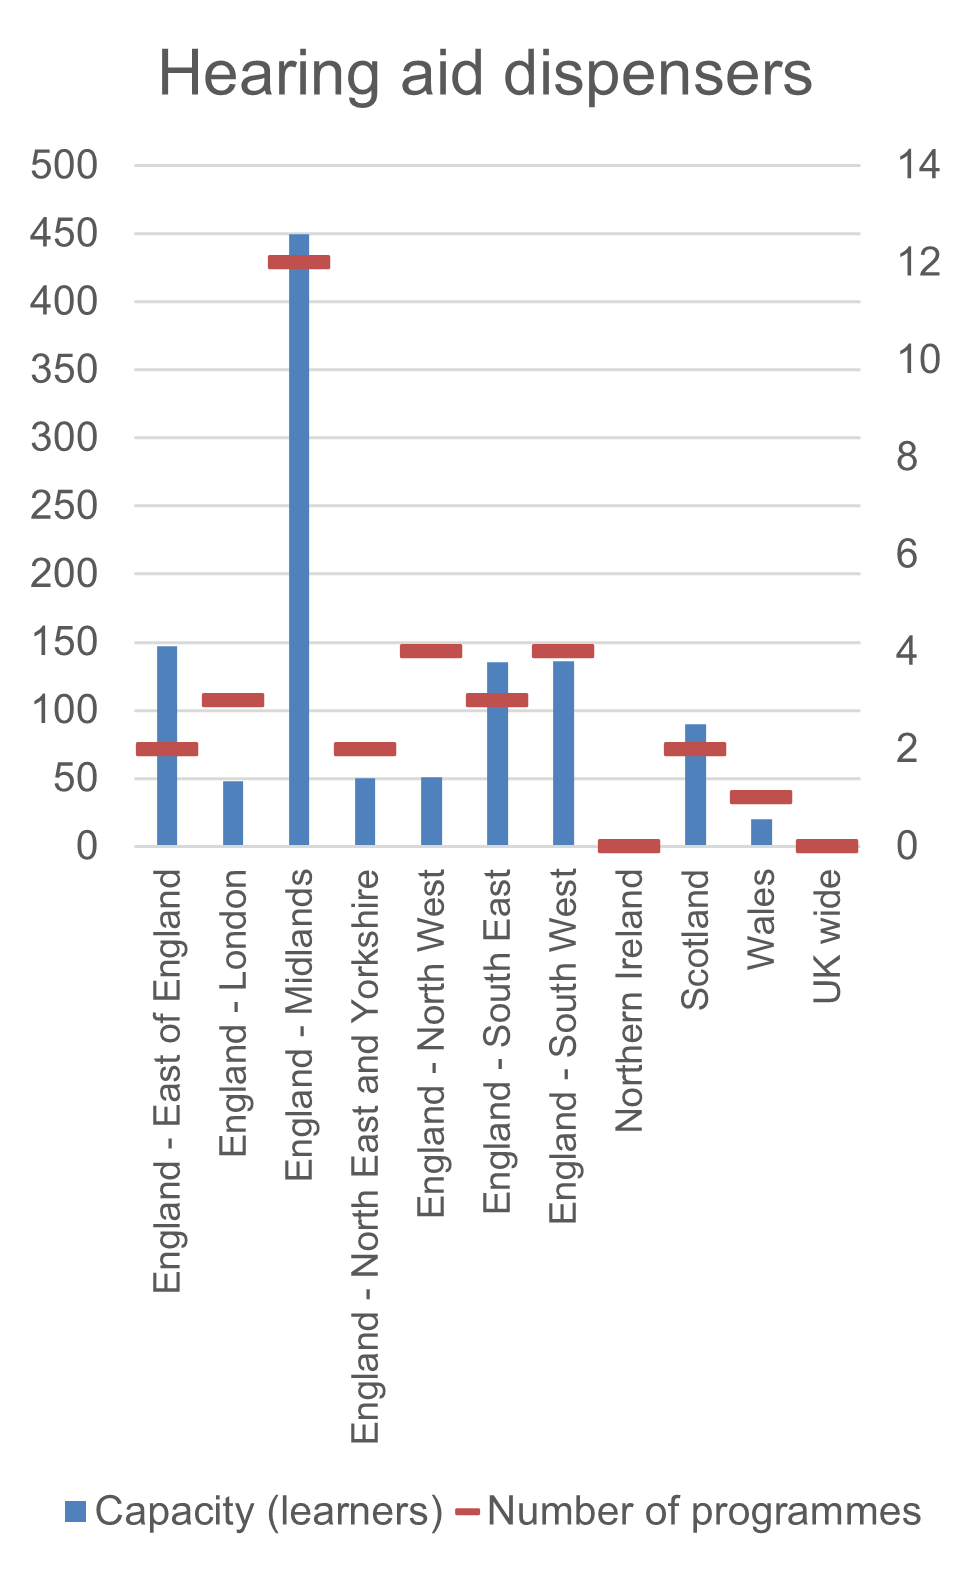
- Hearing aid dispenser – 16% growth (5 additional programmes)
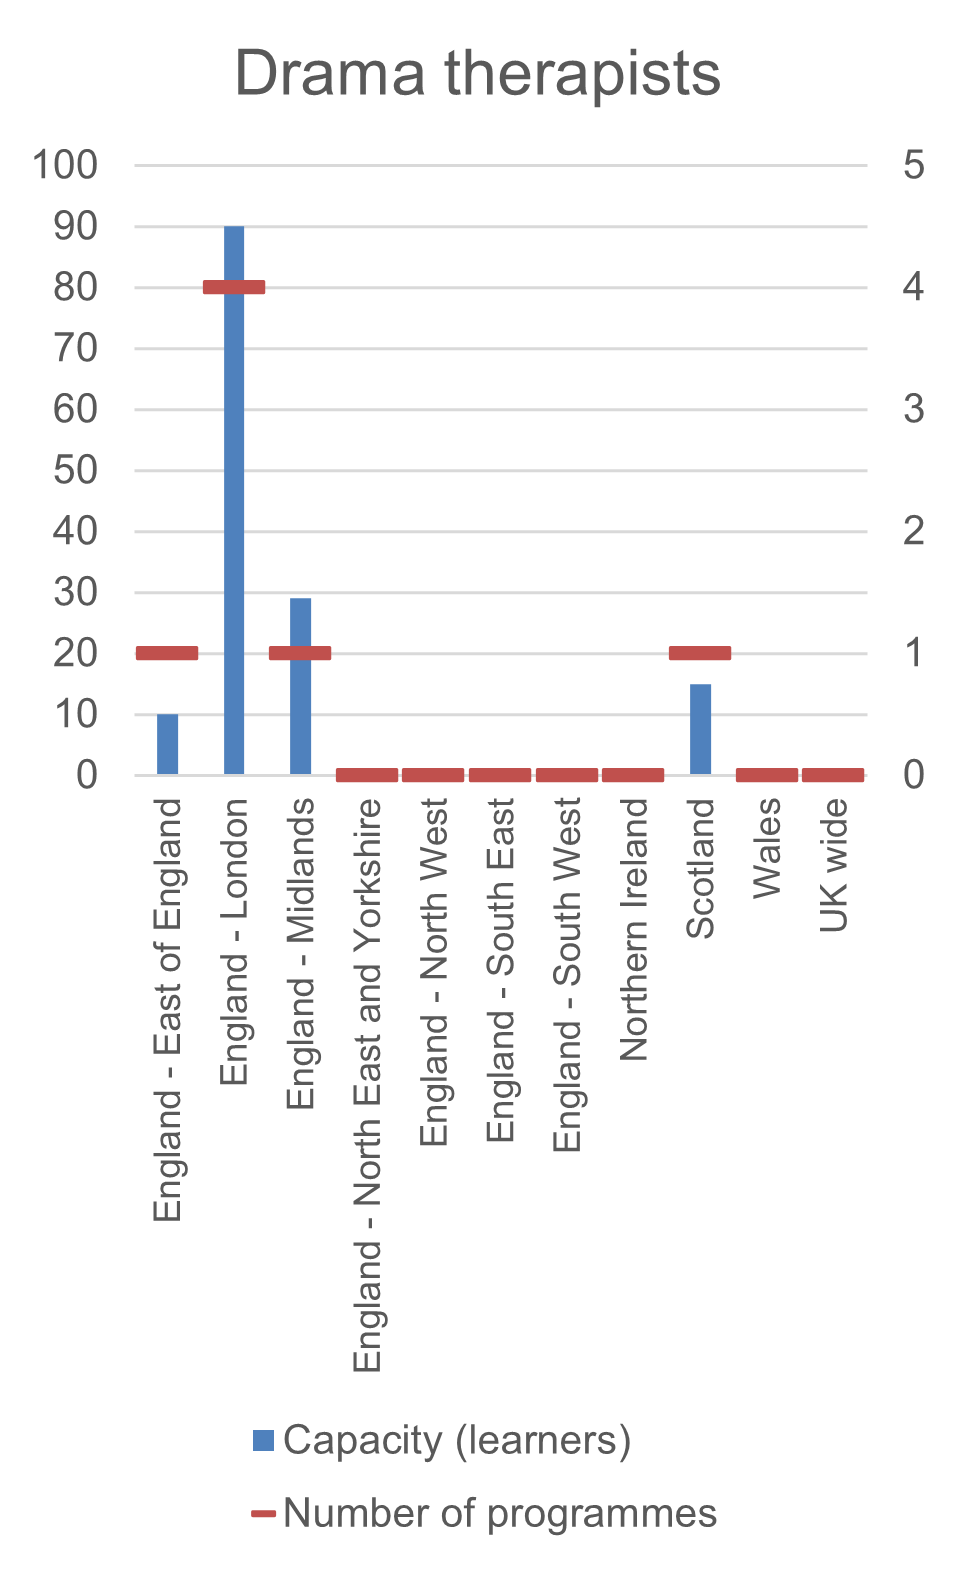
- Drama therapists – 14% growth (however due to small numbers this was only one additional programme)
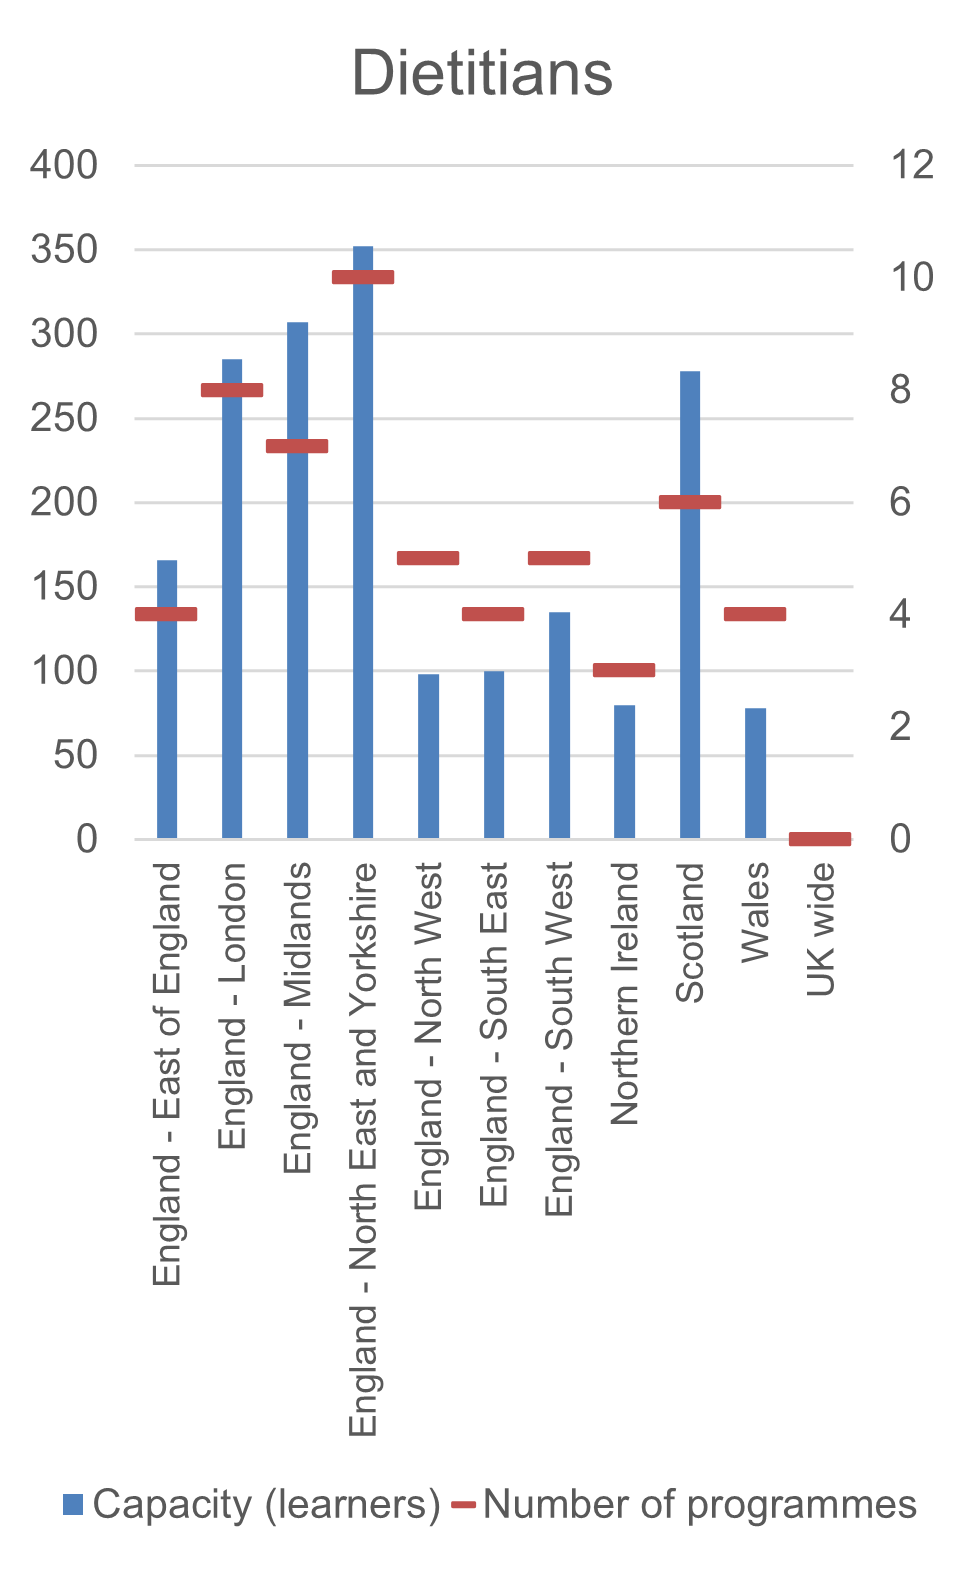
- Dietitian – 11% growth (6 additional programmes)
- Paramedic – 11% growth (9 additional programmes)
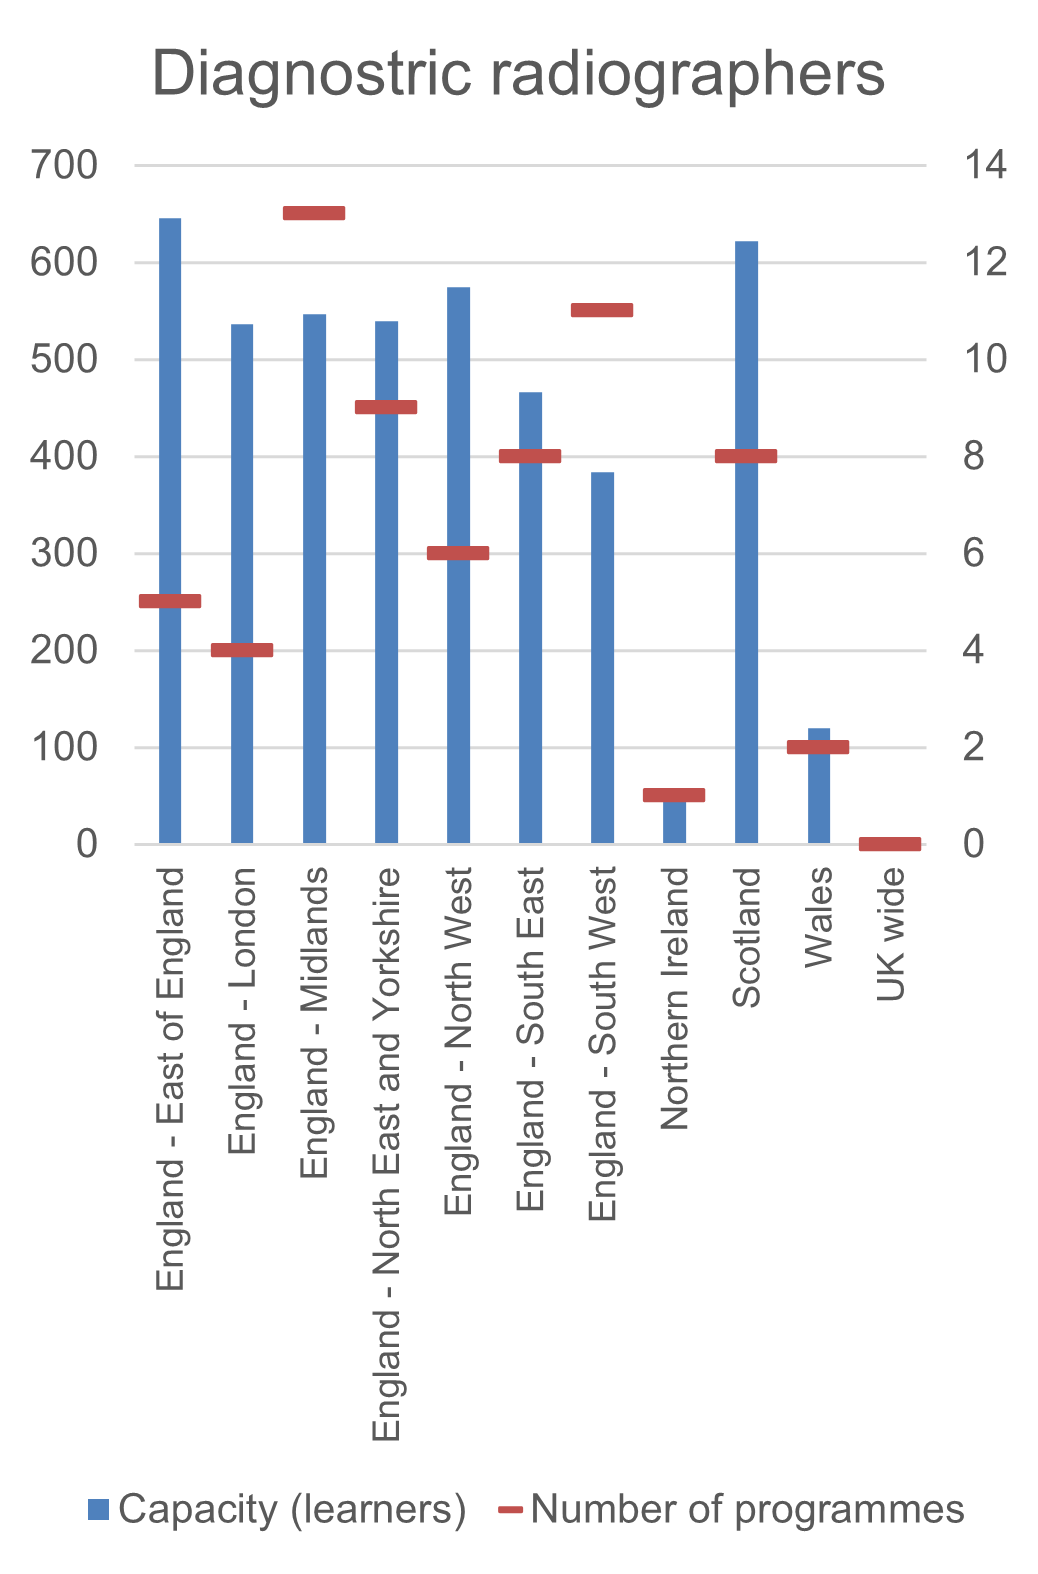
- Diagnostic radiographer – 9% growth (6 additional programmes)
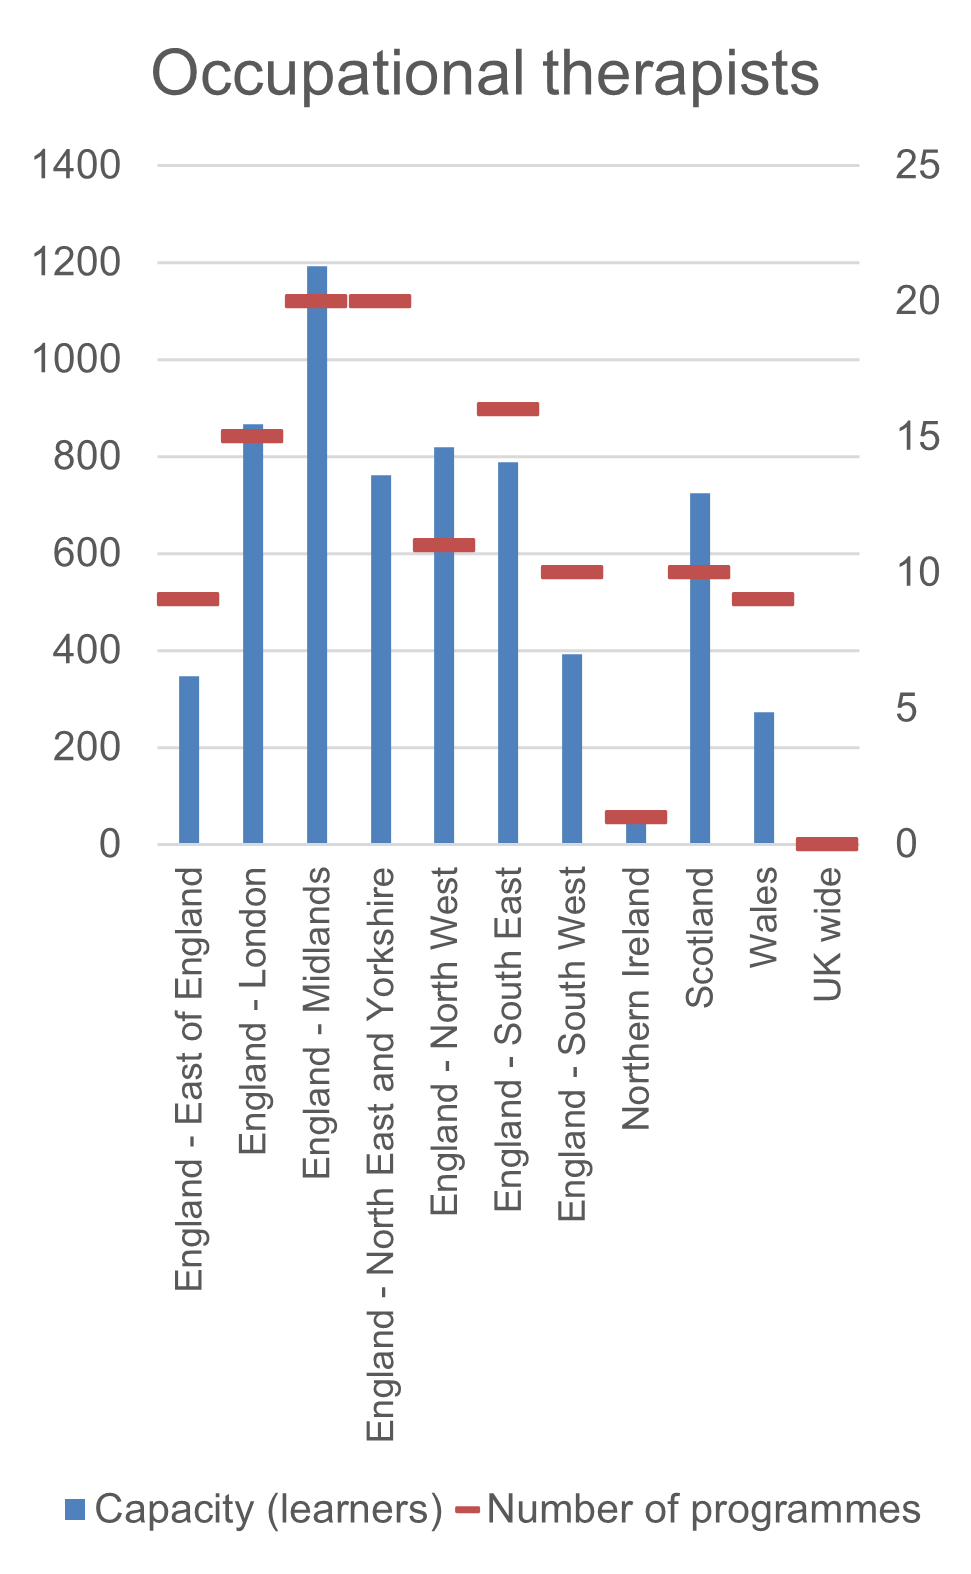
- Occupational therapist – 9% growth (11 additional programmes)
- Biomedical scientist – 8% growth (4 additional programmes)
There were smaller percentage increases for art therapists, operating department practice, physiotherapists, therapeutic radiographers, and speech and language therapists. Programme numbers for the remaining professions / modalities did not grow.
Growth in programme numbers did not translate to the percentage level of growth for the capacity of learner numbers. For all professions, there was a lower level of growth for the overall capacity of programmes. This shows that newer programmes are developed at a smaller scale than existing programmes.
There is a shift in the profile of professional education, with a higher percentage of degree apprenticeship programmes being developed than baseline percentages for most professions. This is linked with the apprenticeship initiative in England, and we may see the shift to more apprenticeship provision continue to be developed as part of the sector’s response to the NHS 10 Year Plan for England. Other nations are also considering introducing apprenticeship or ‘earn and learn’ routes into the professions that we regulate, although the structures to support these routes have not yet been set up in these nations.
We have presented a comparison of numbers of programmes and learner capacit for all professions / modalities in table below. This is to show how increases in the number of approved programmes links to increases in the overall learner capacity for each profession and modality. This can be used by stakeholders to understand how new provision being developed contributes to capacity.
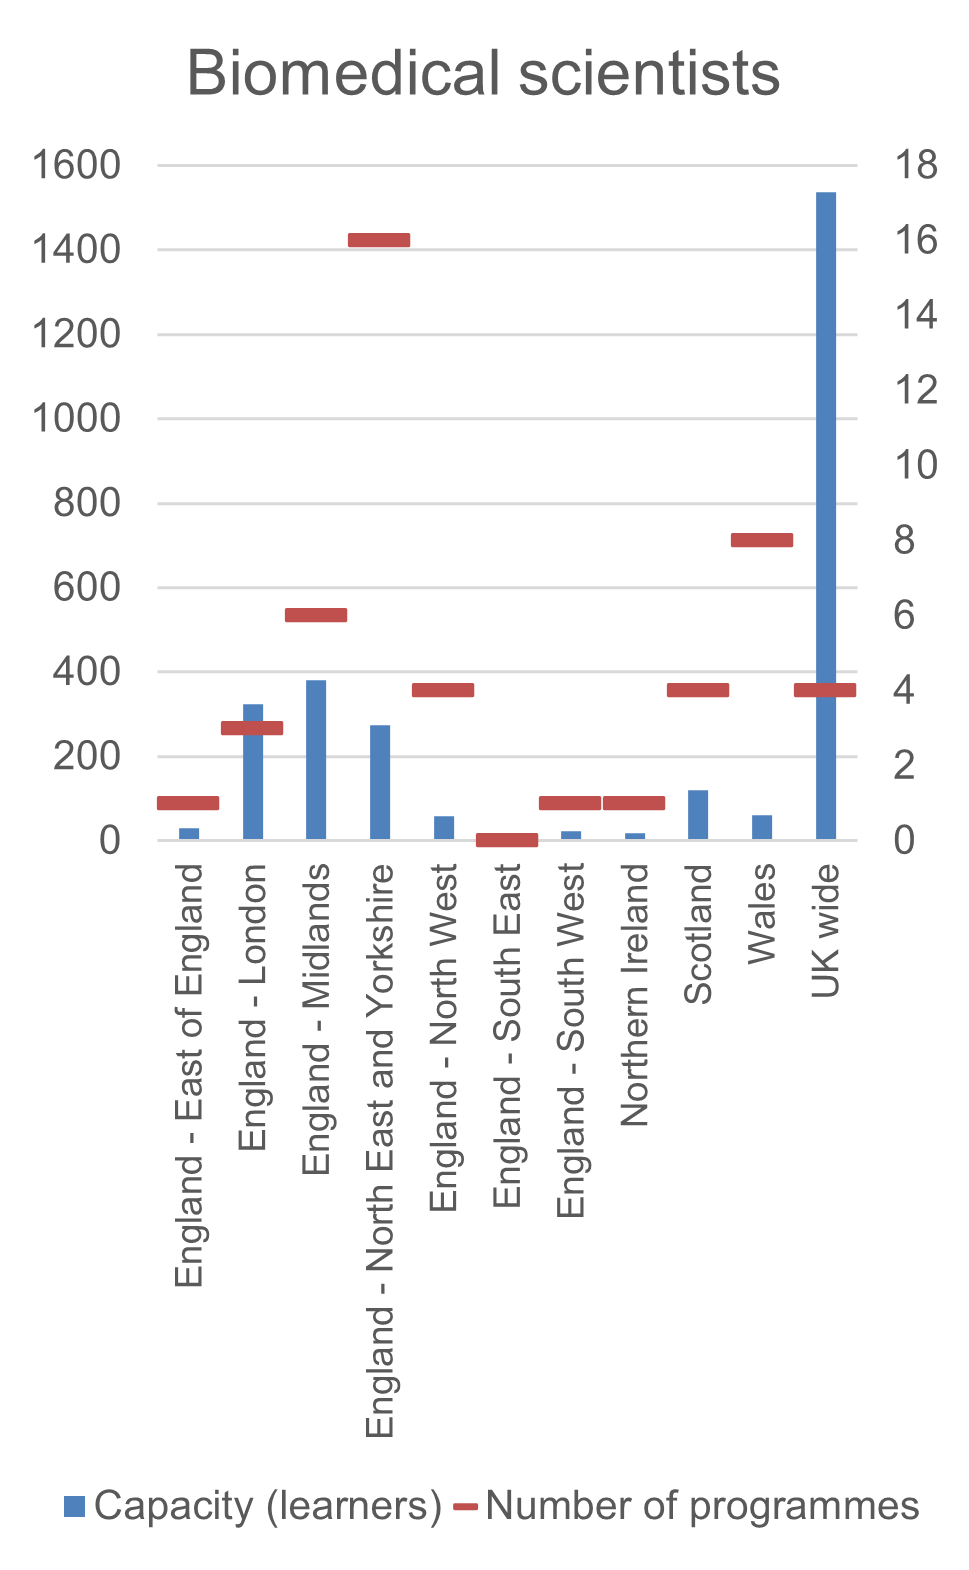
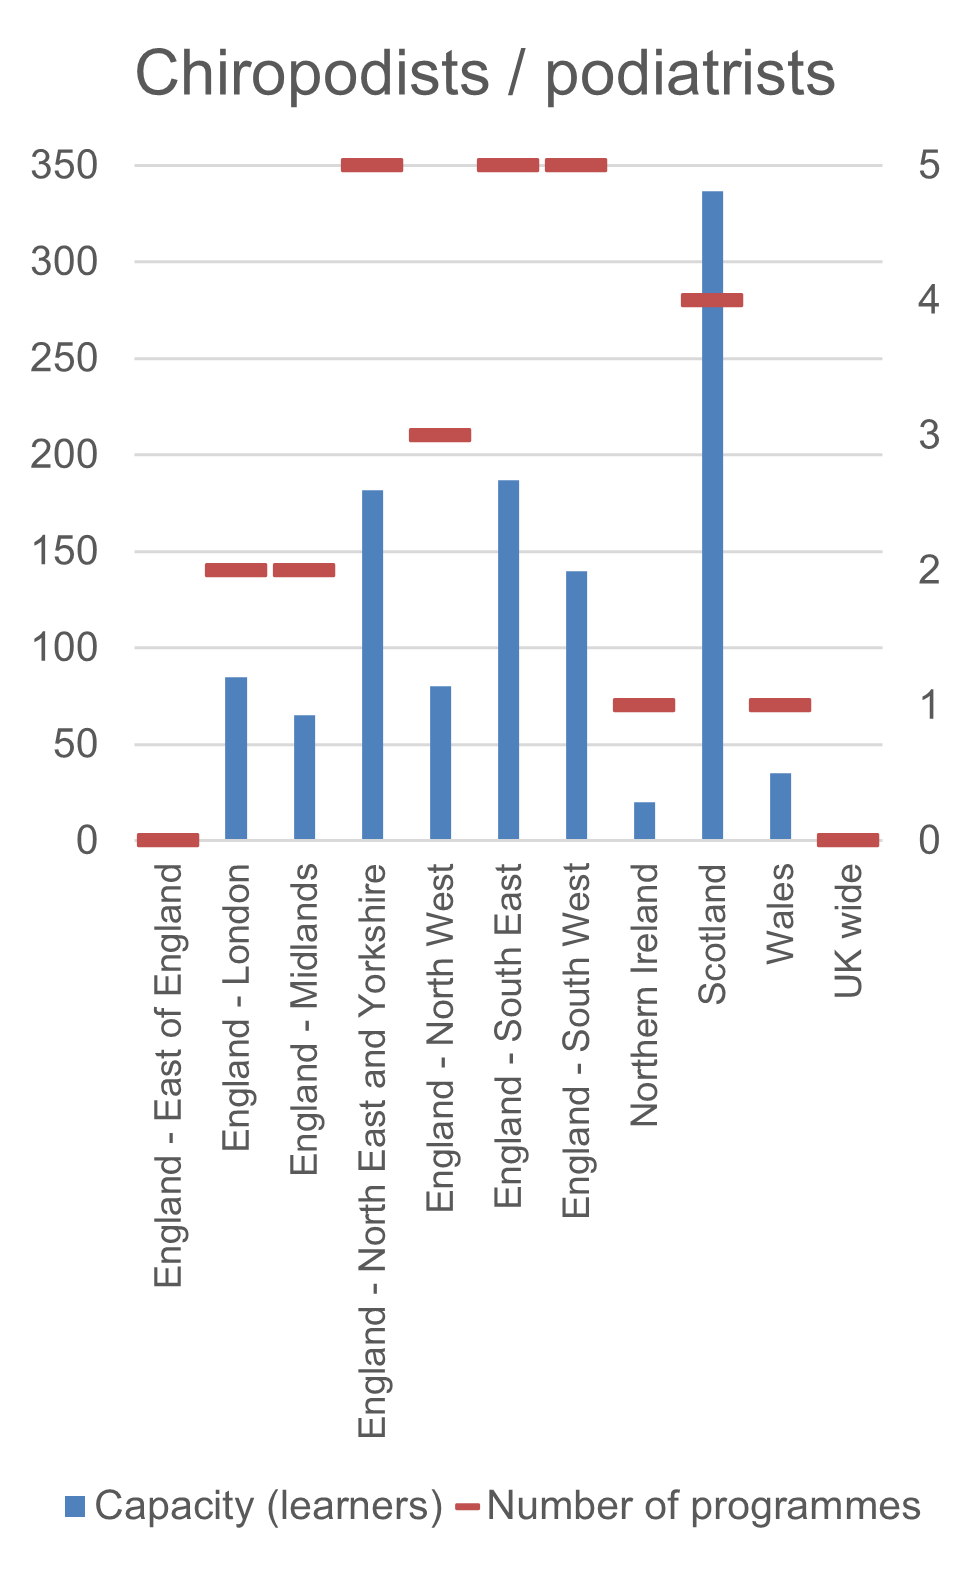
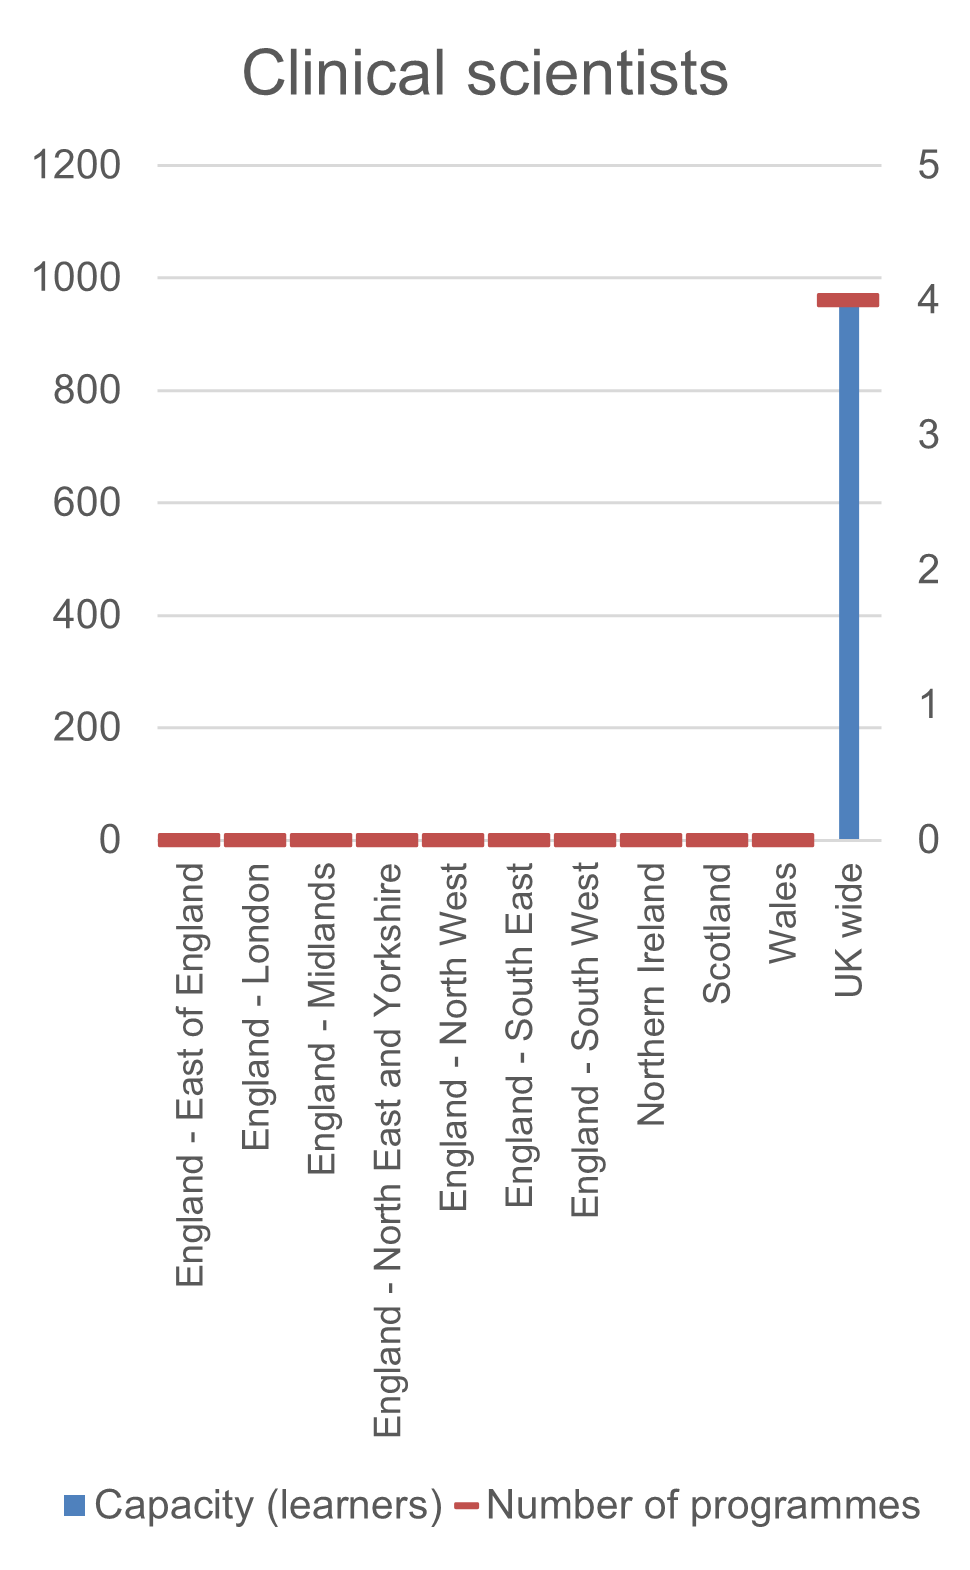
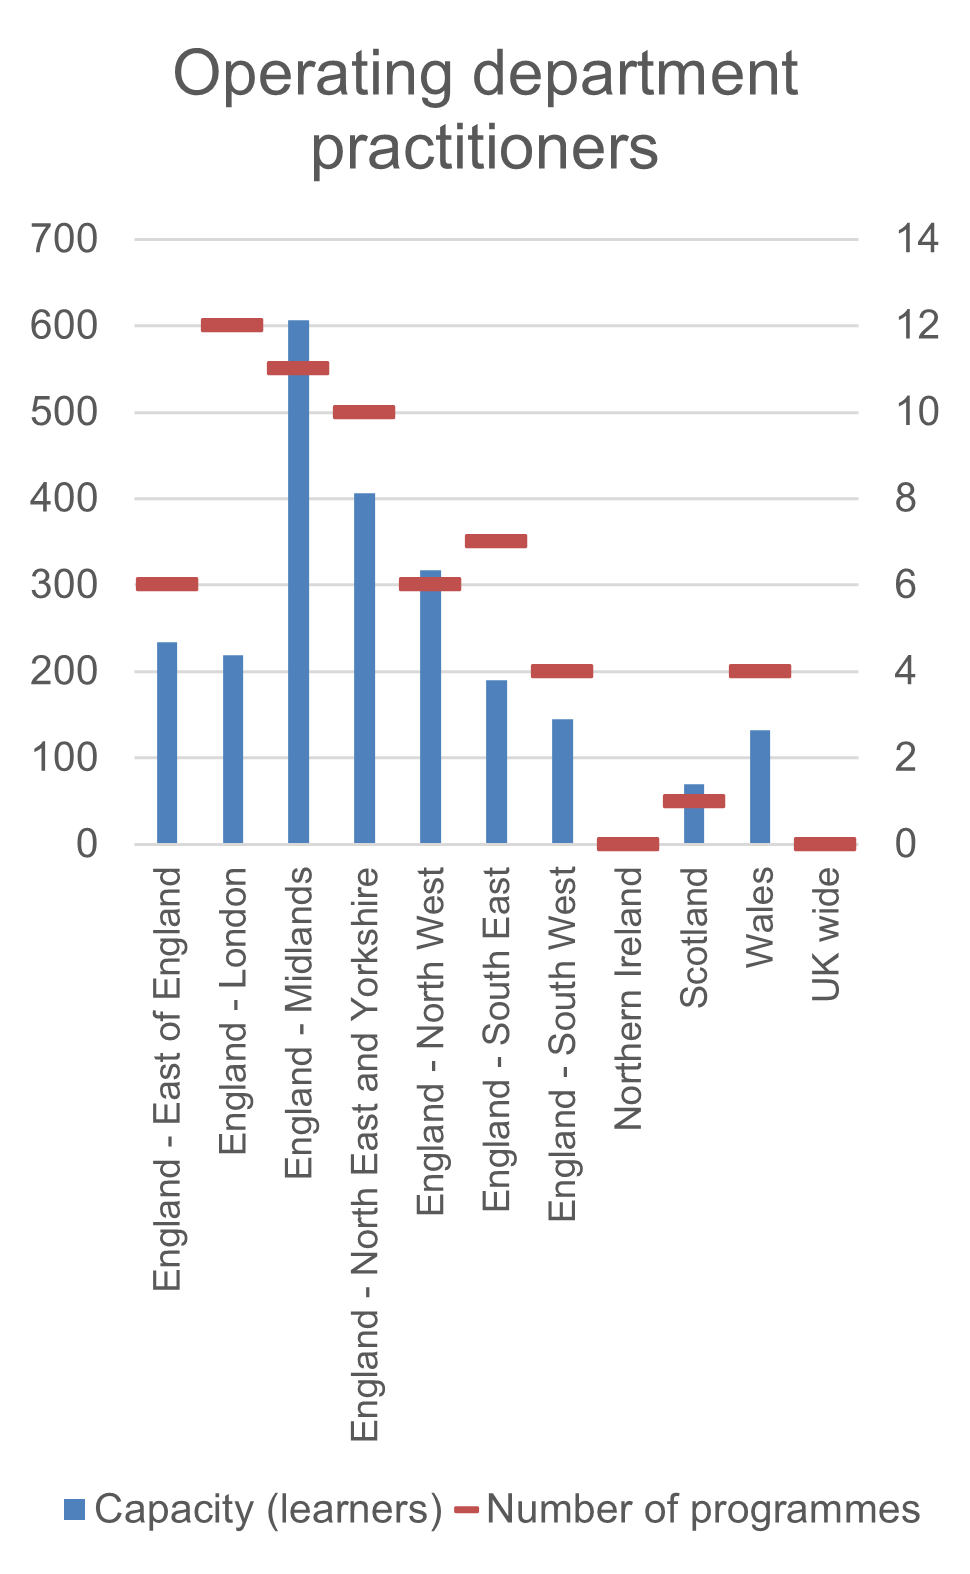
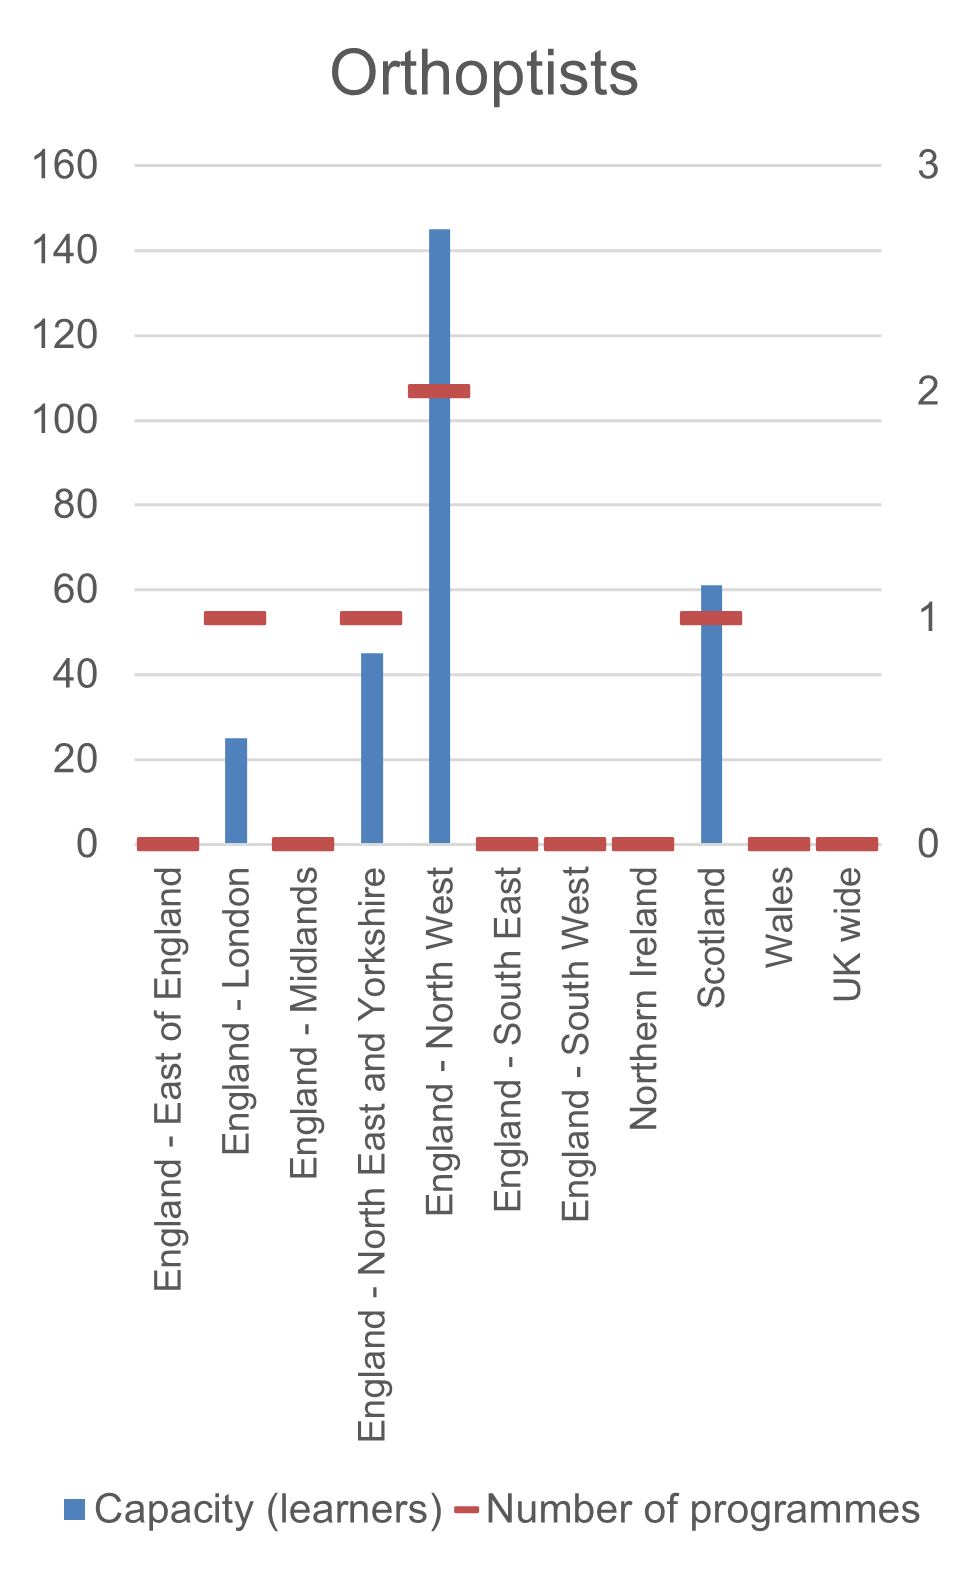
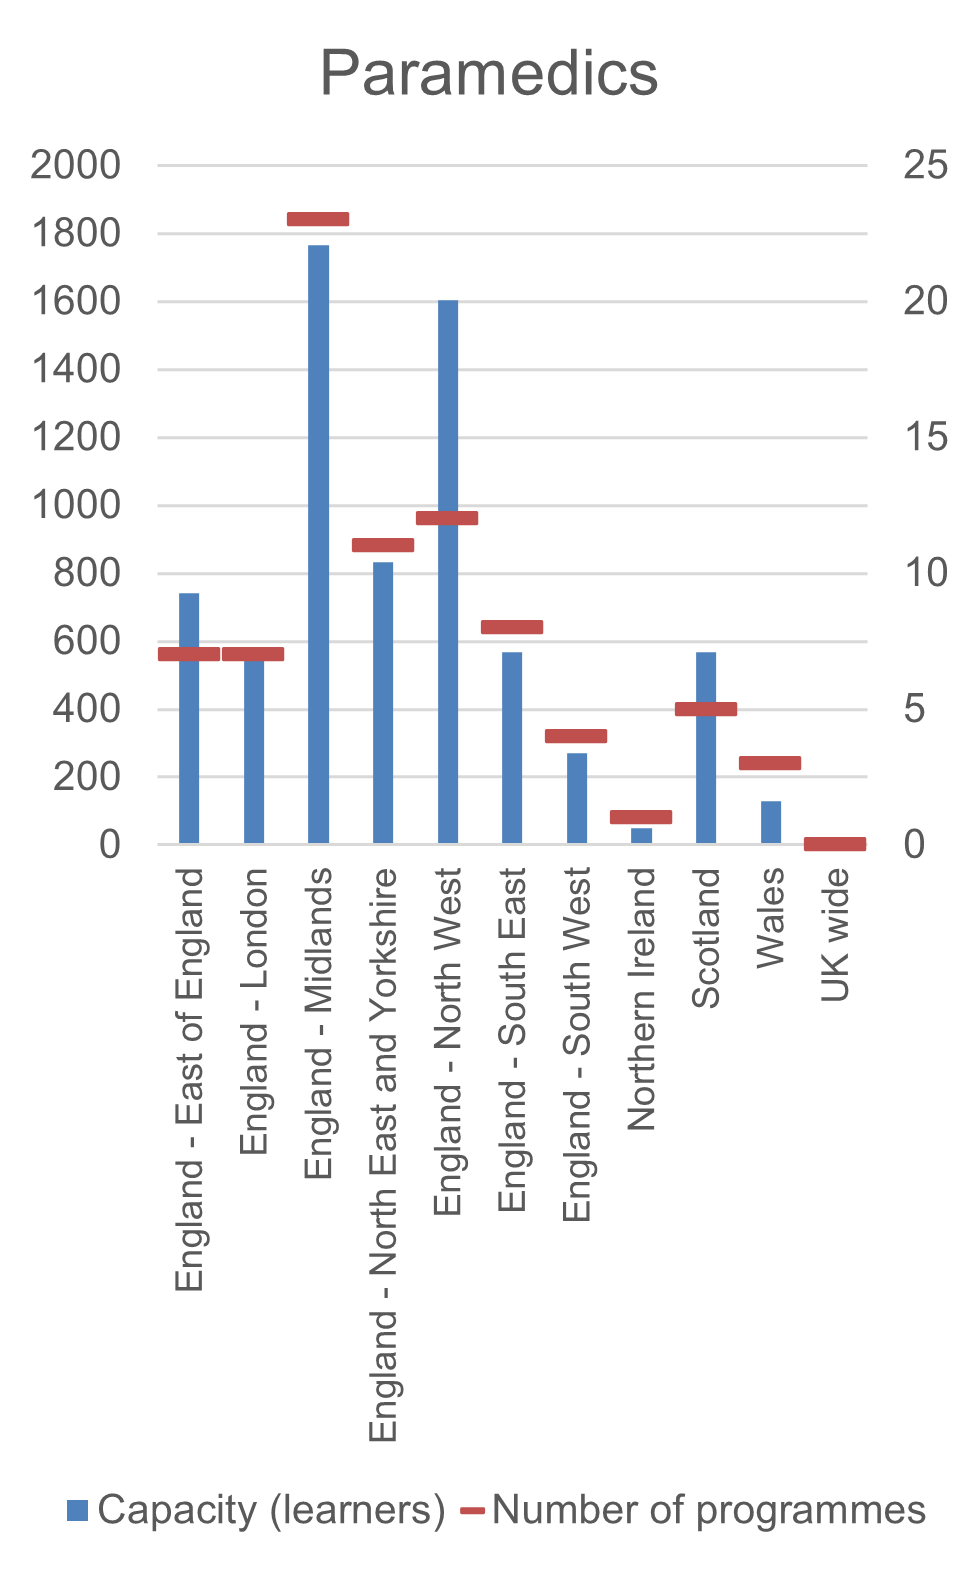
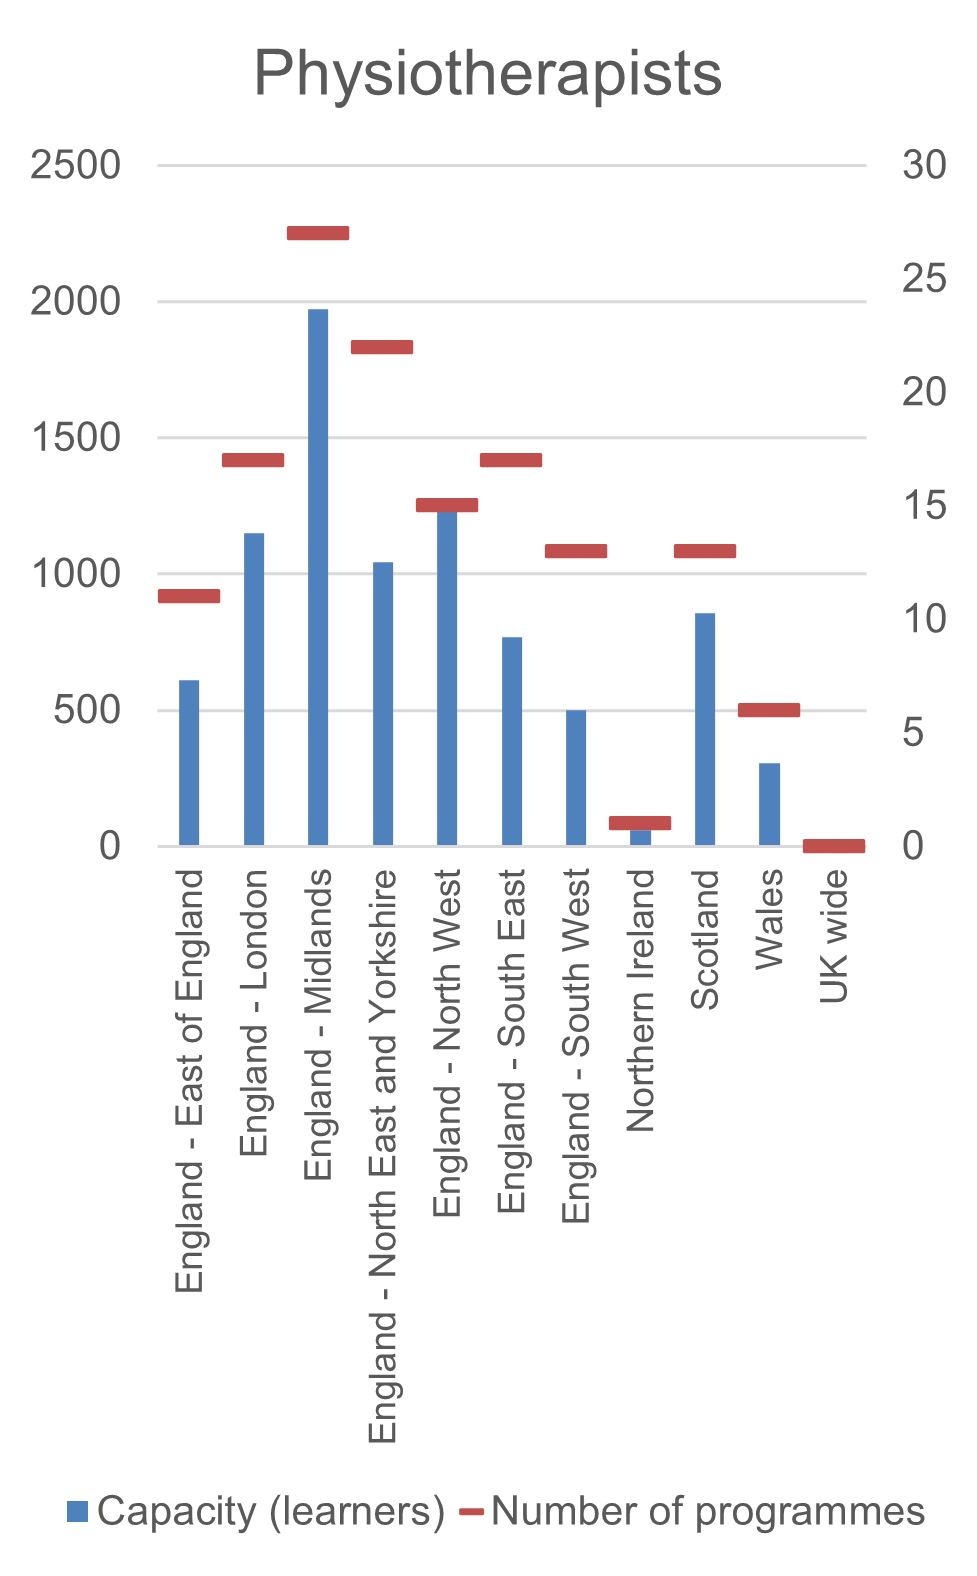
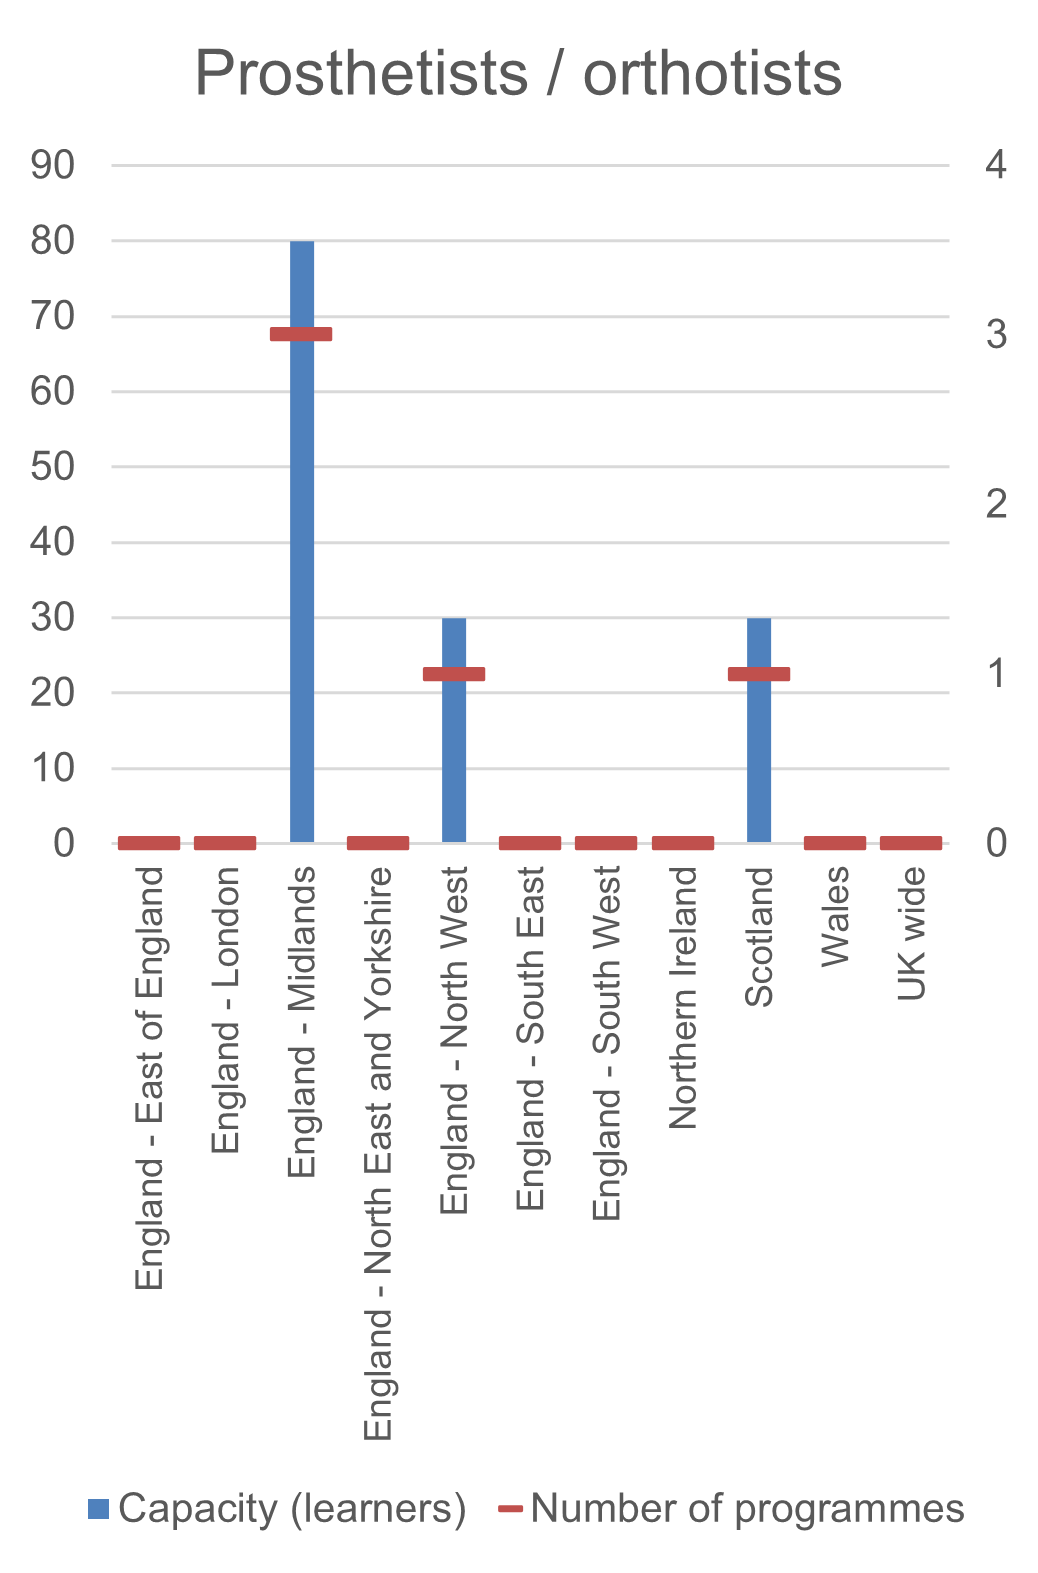
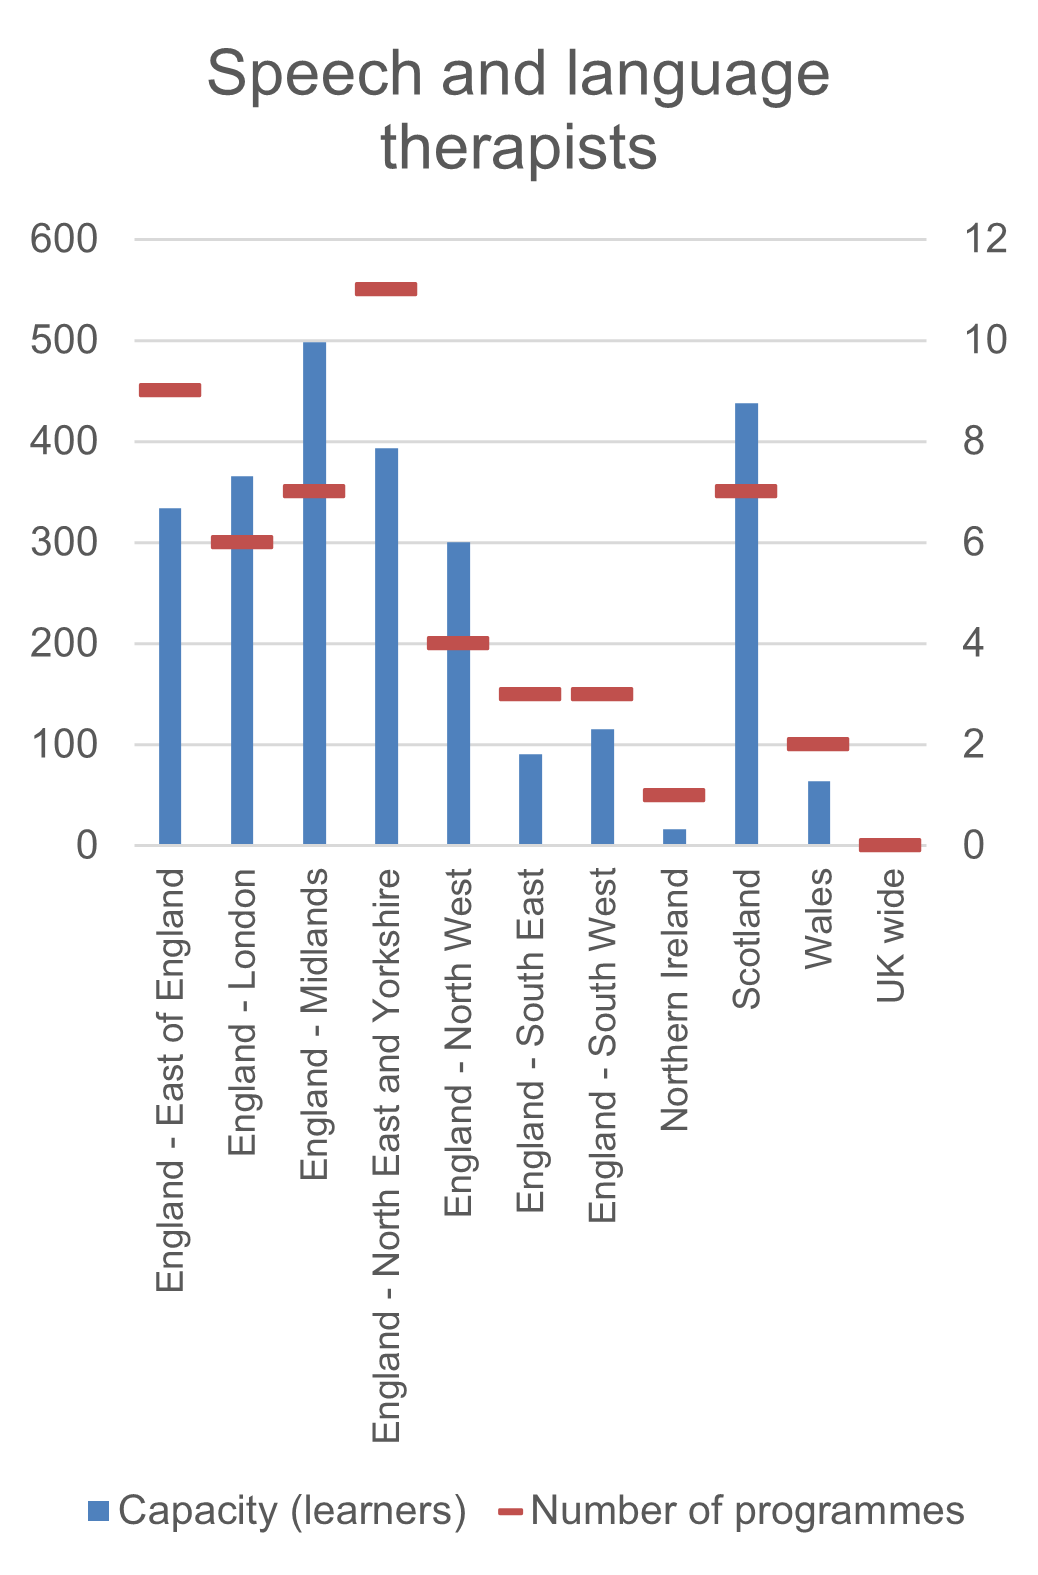
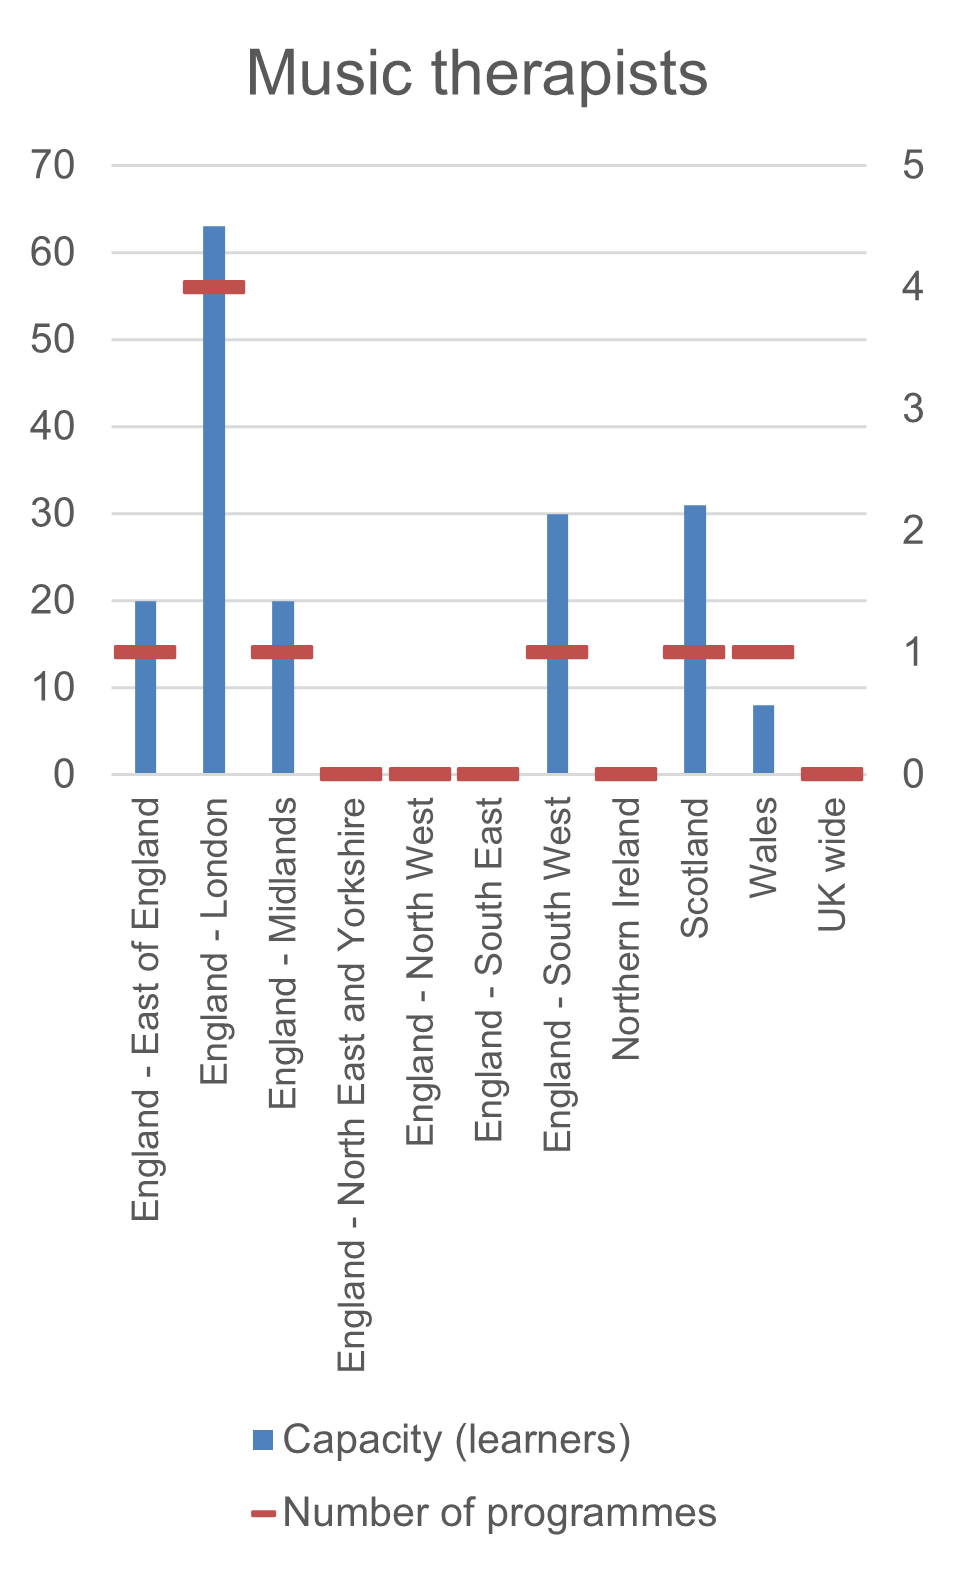
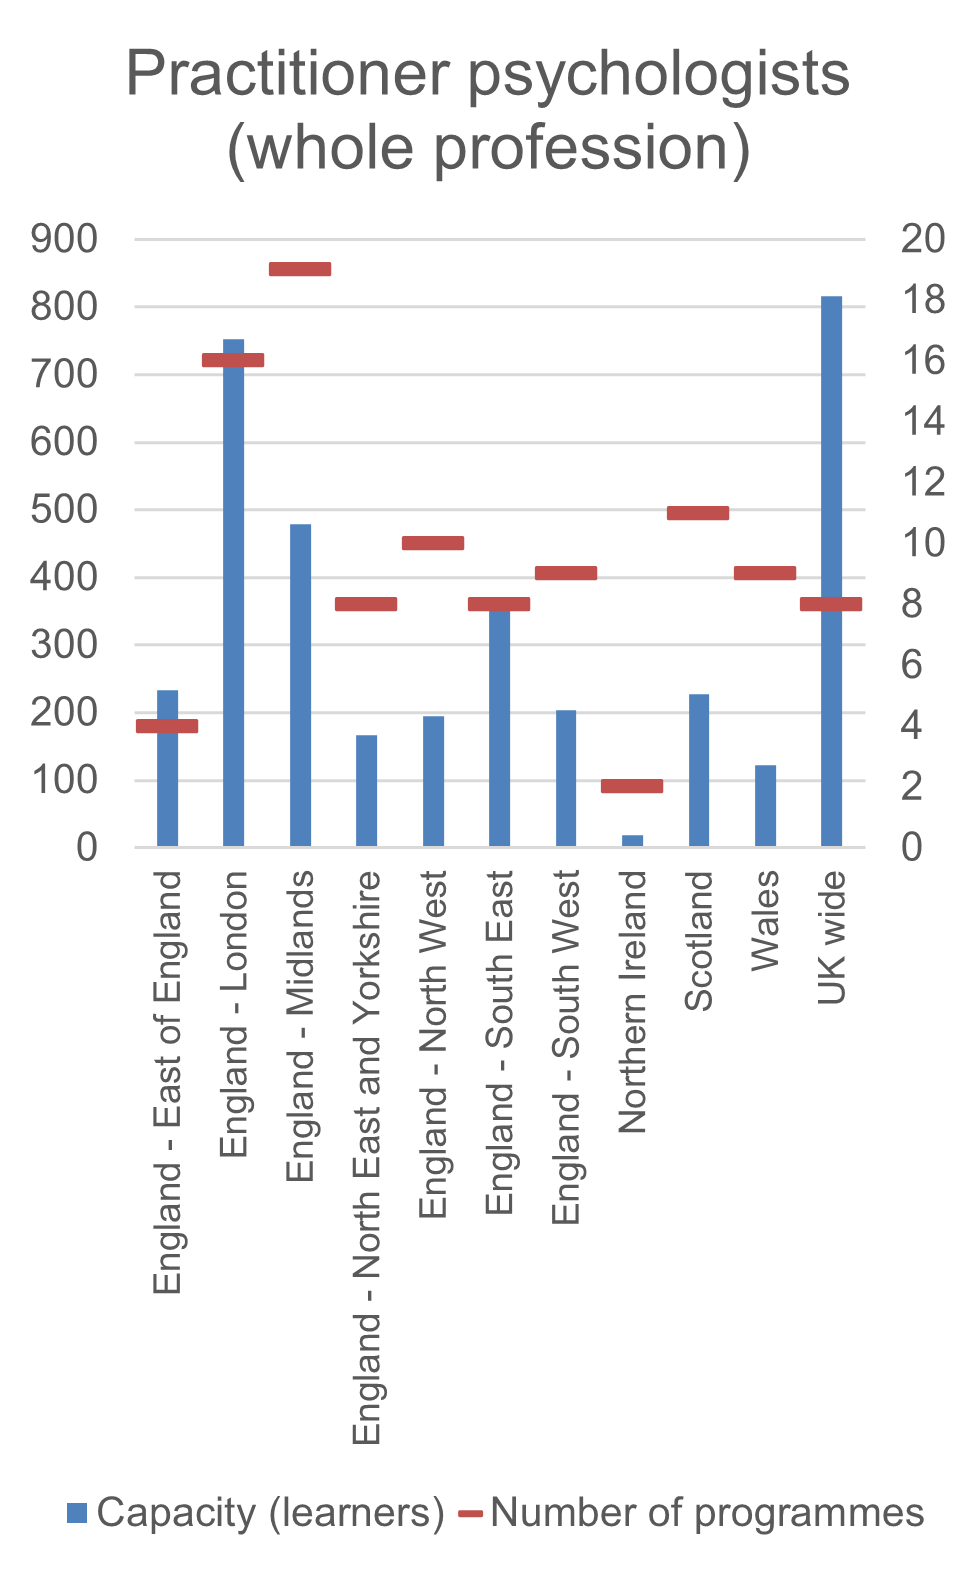
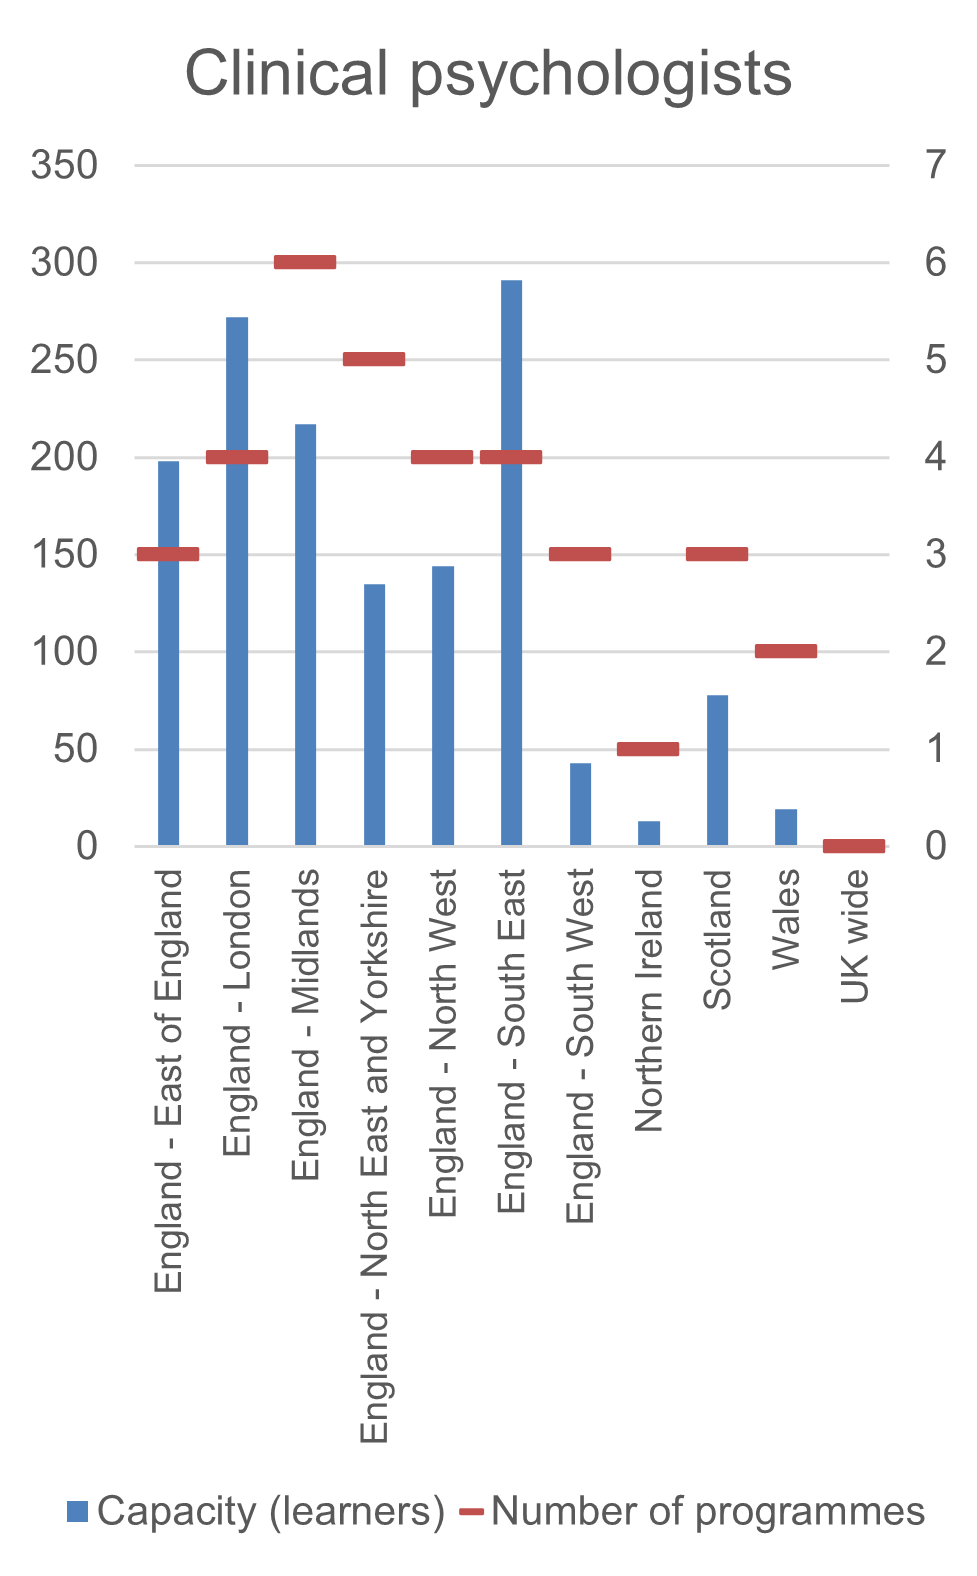
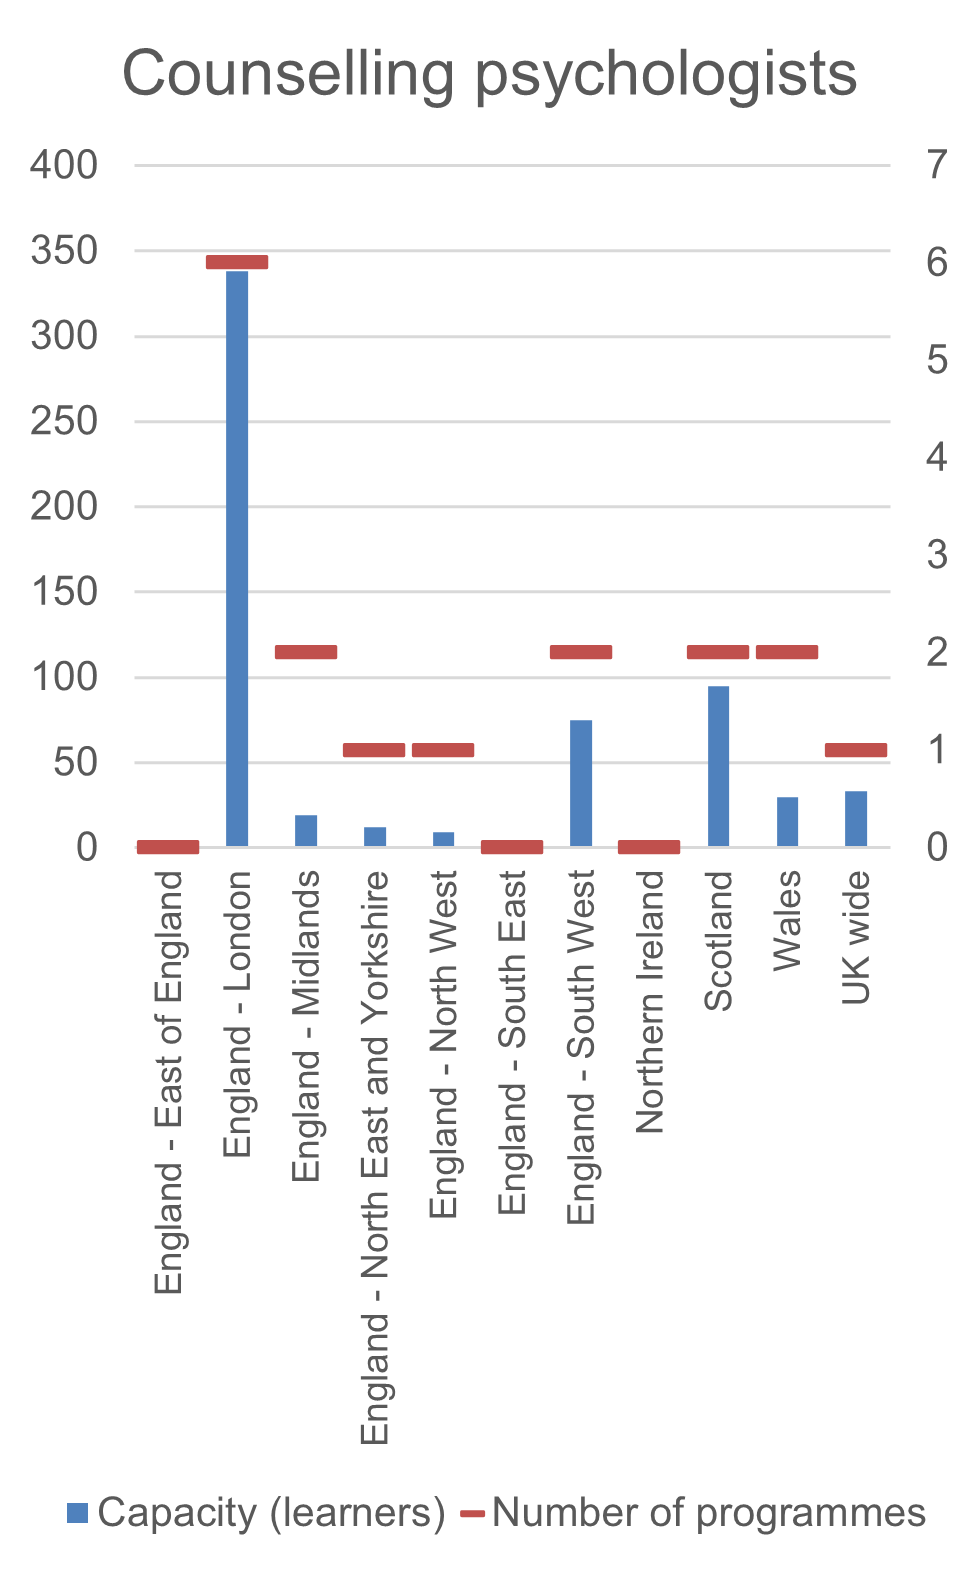
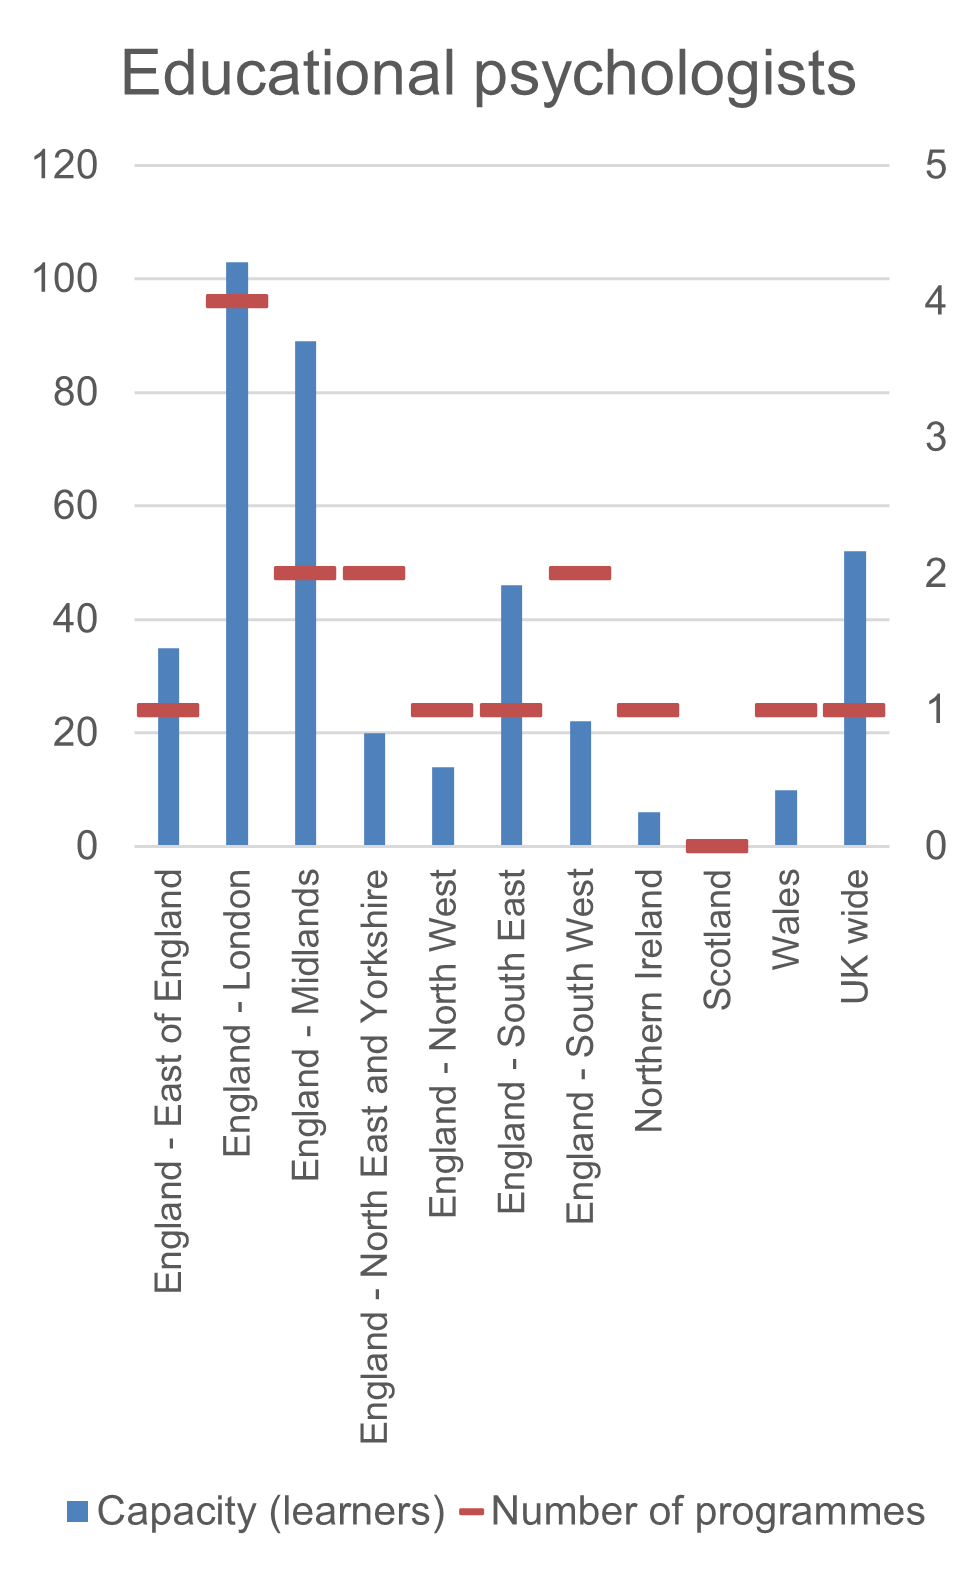
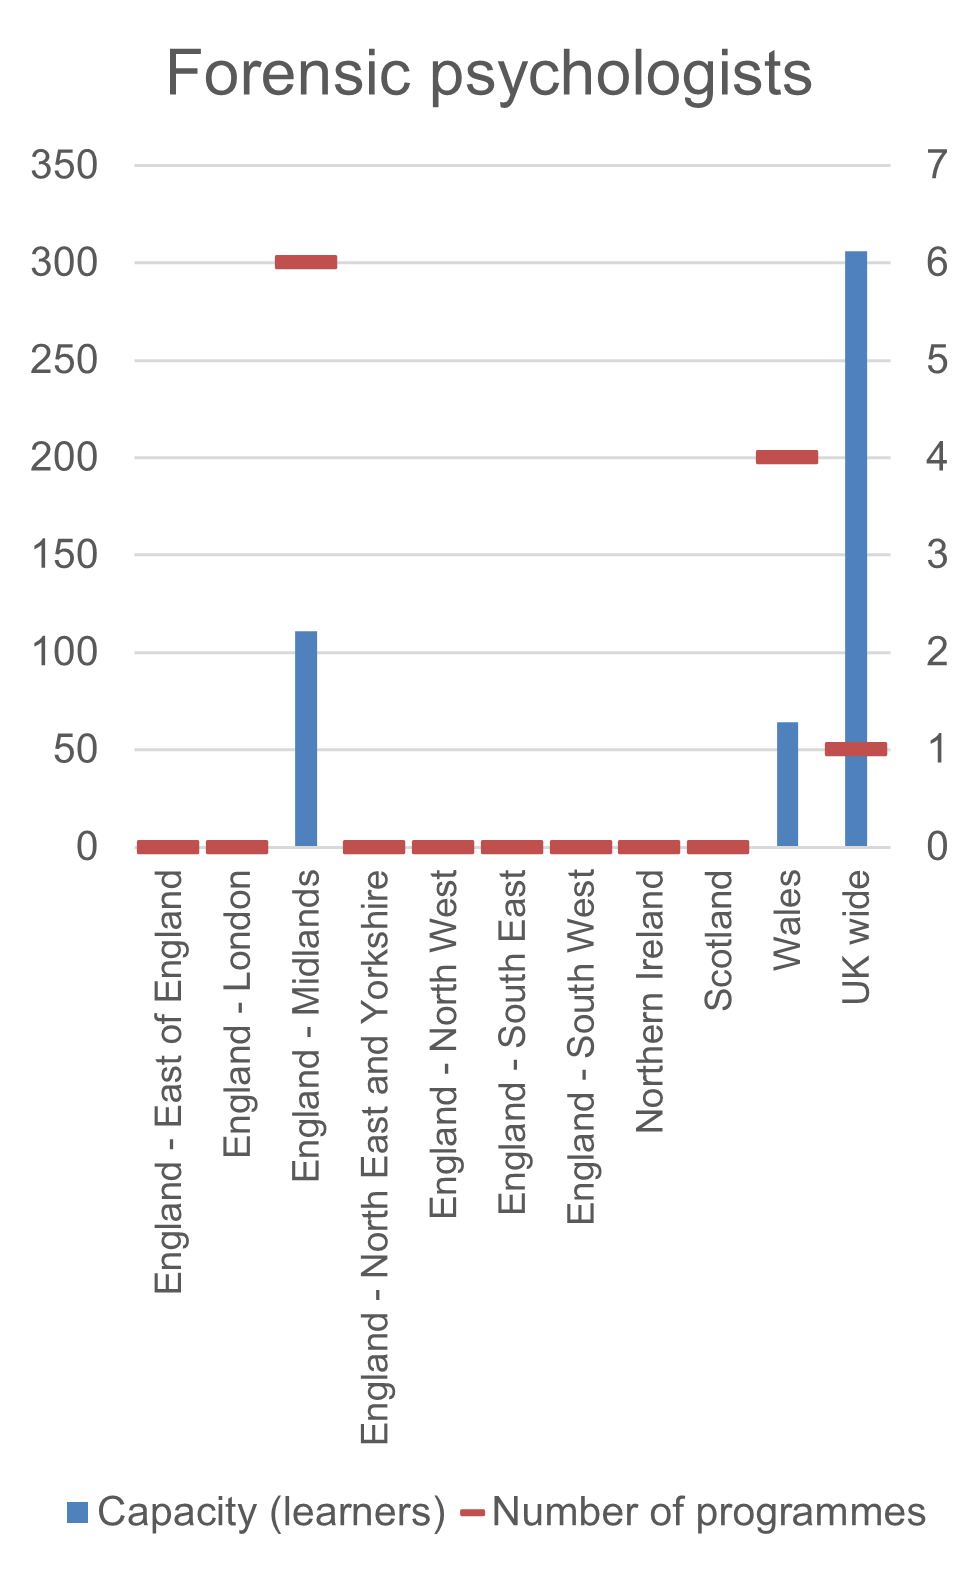
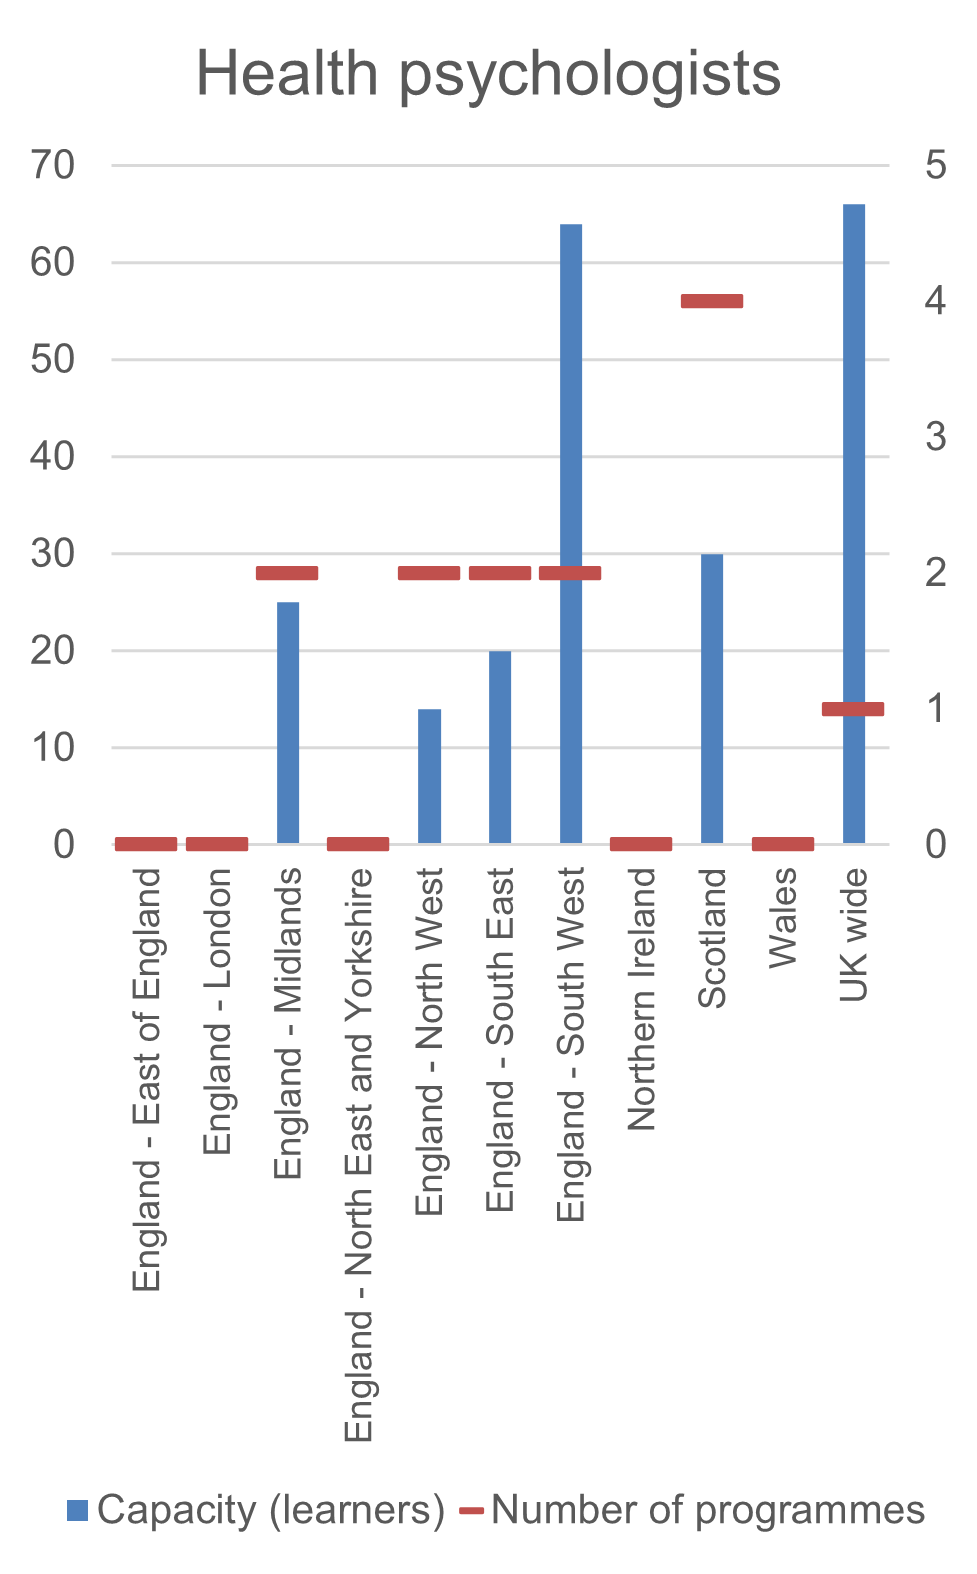
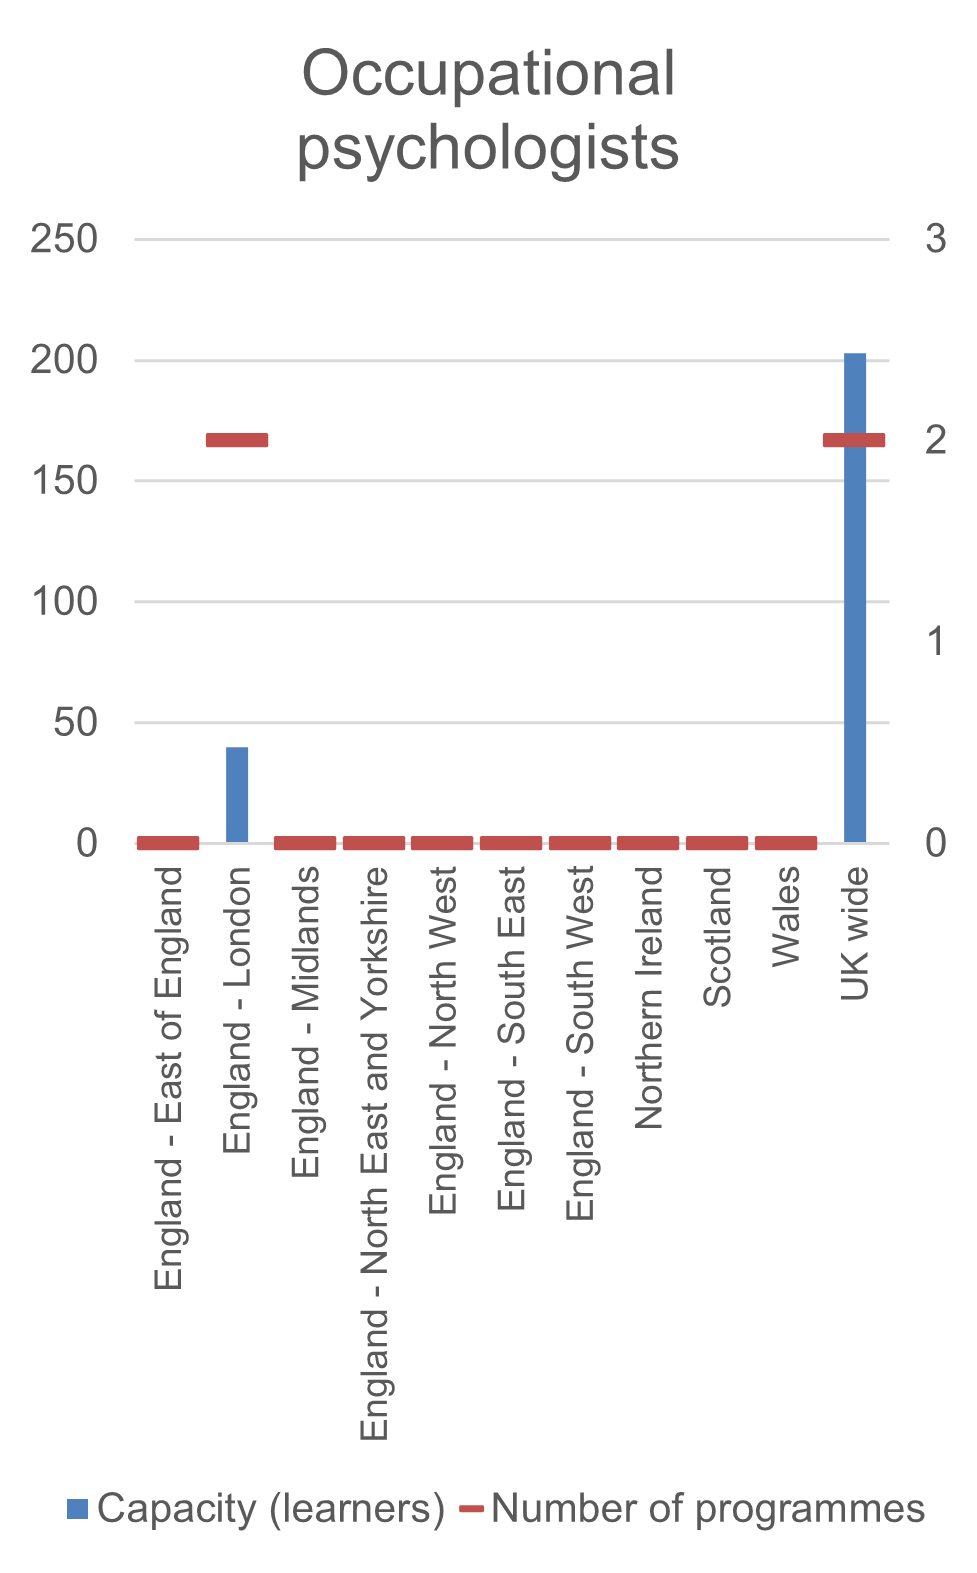
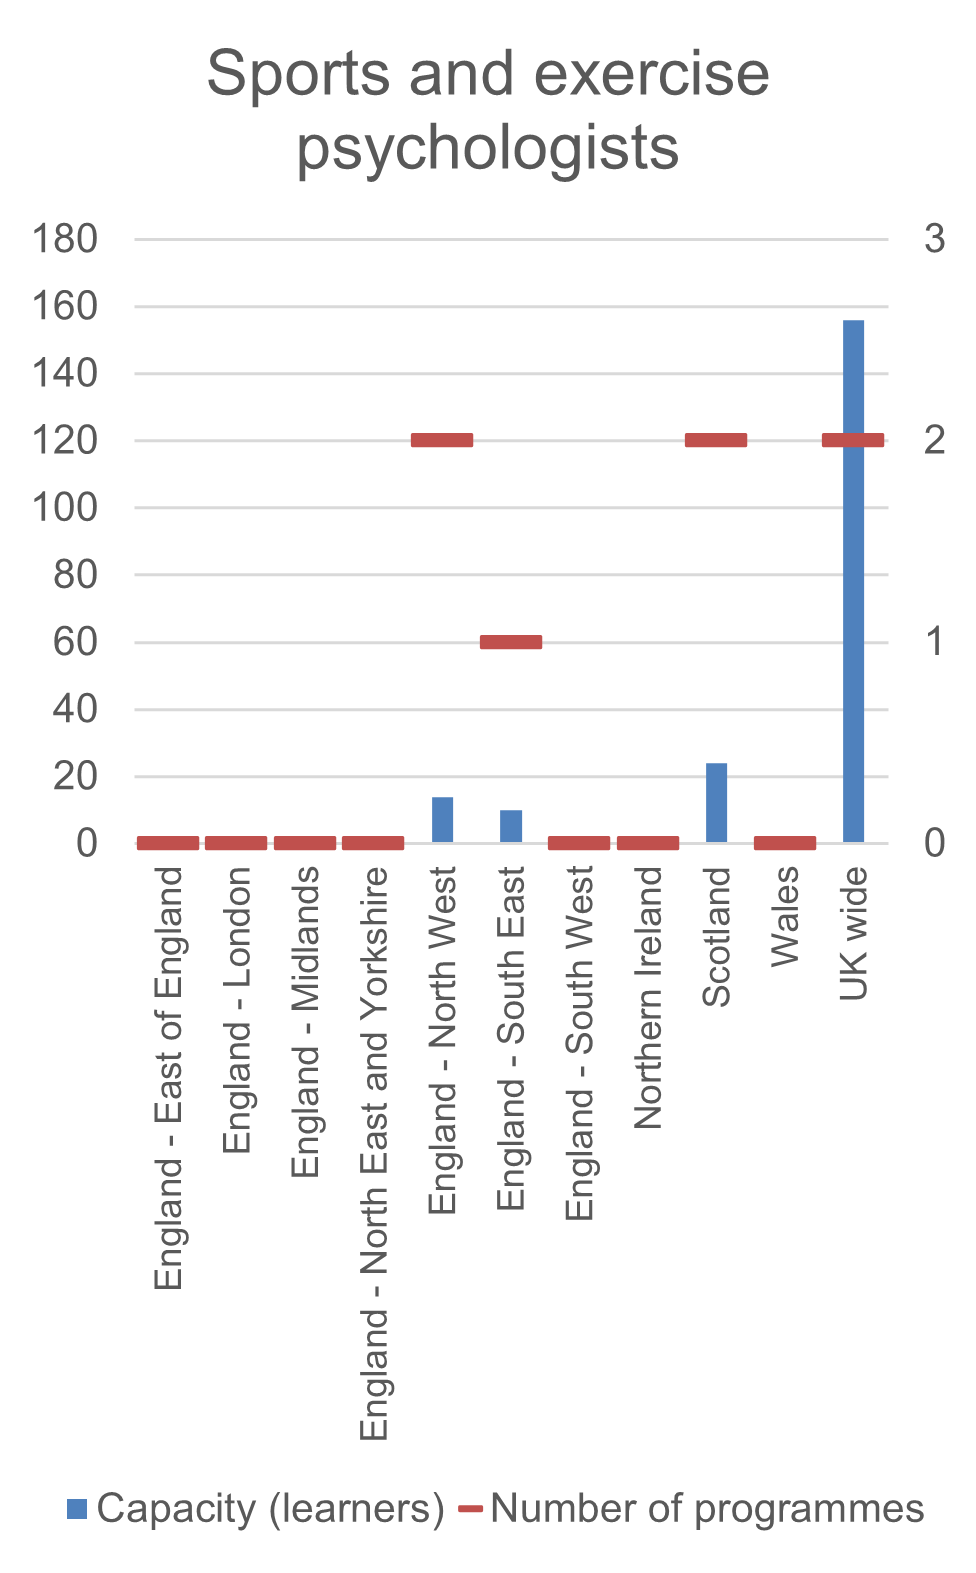
Nations and regions
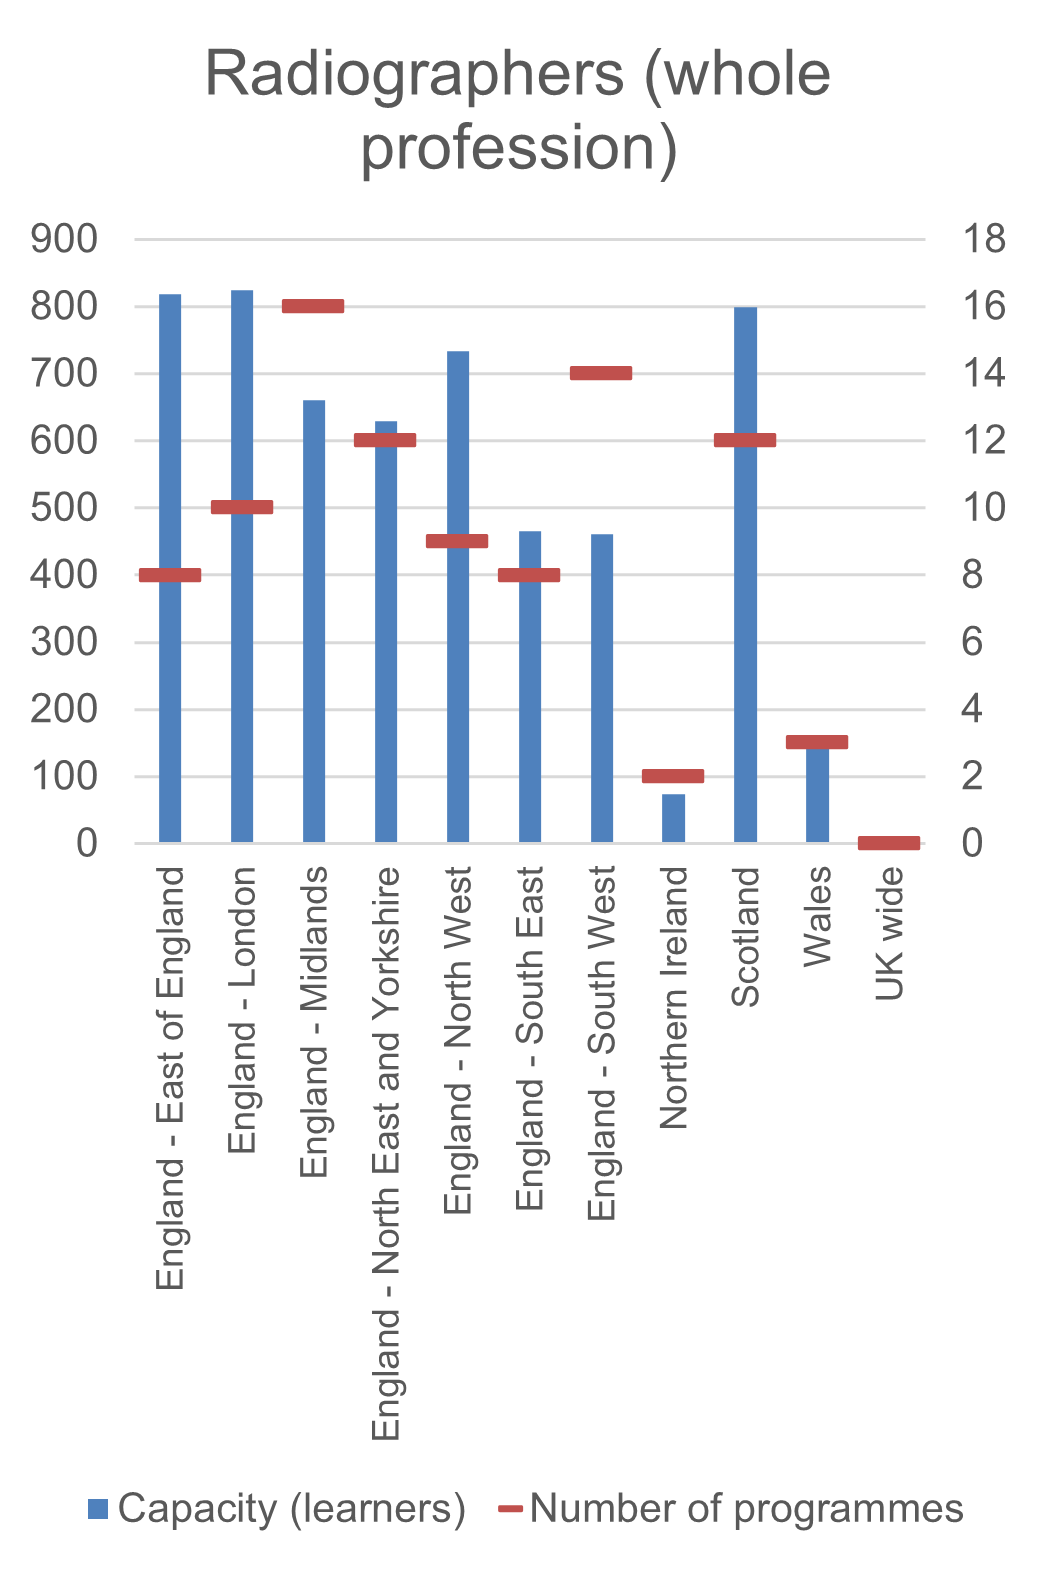
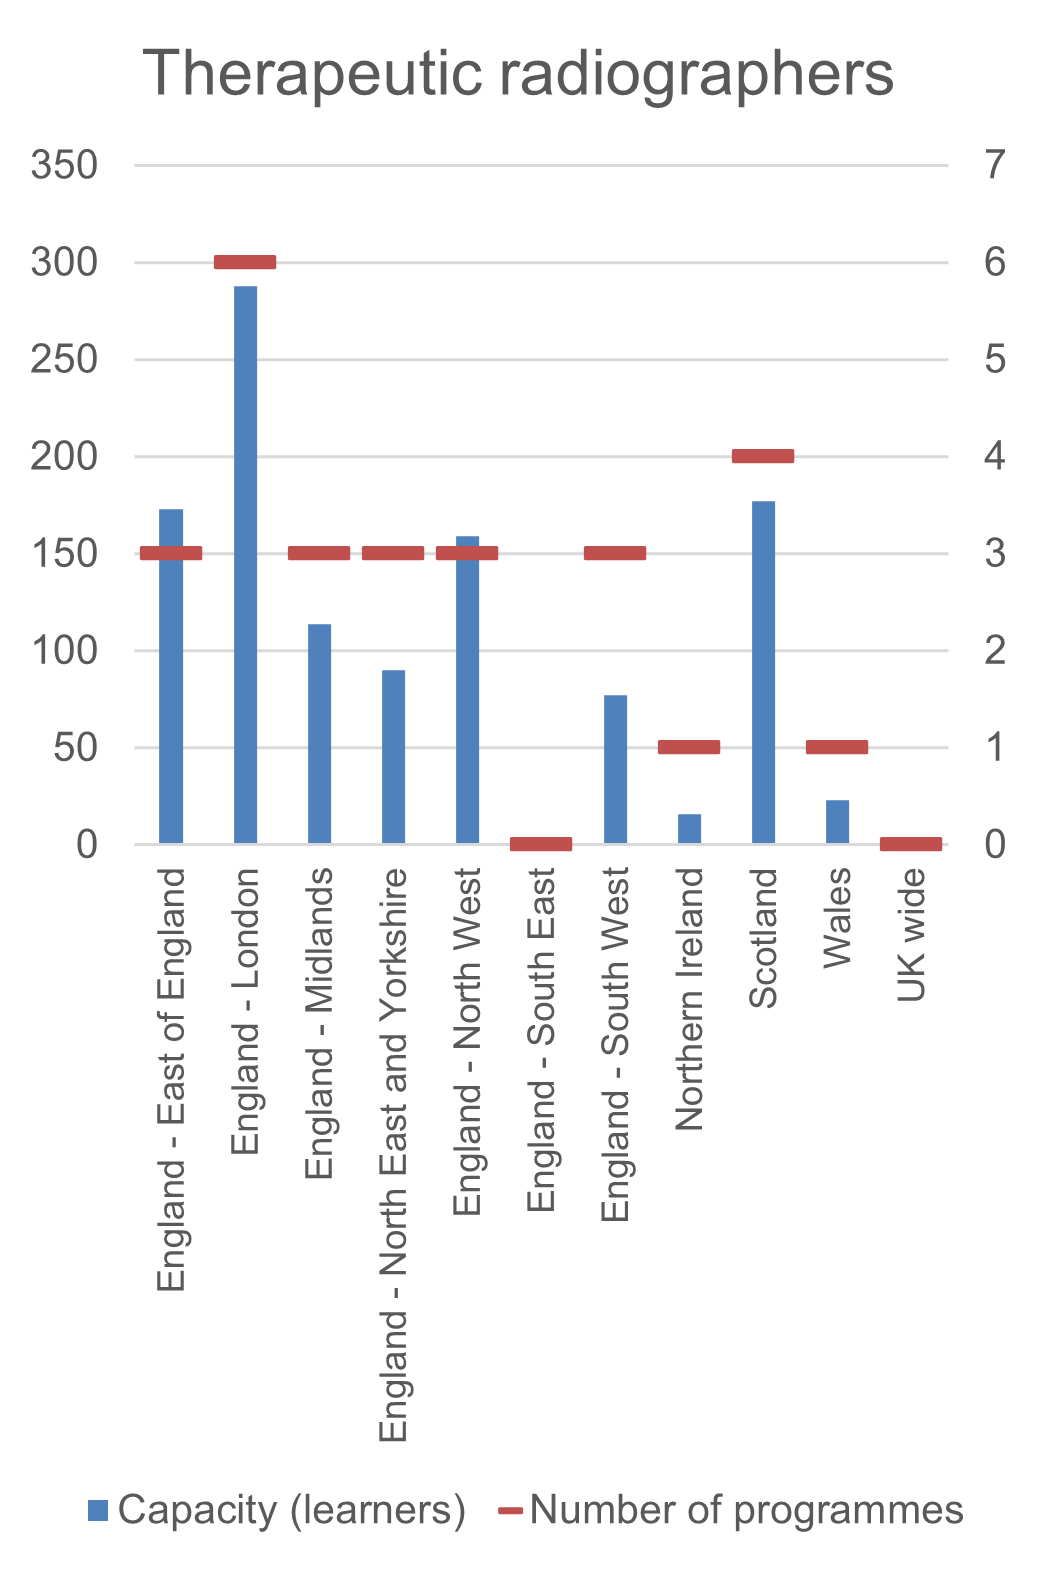
We have produced the following charts which show learner number capacity (blue bars) and the number of approved programmes (orange lines) in each nation and English region. These charts are provided to give insight into the current national and regional picture within professions.
From the charts, the total capacity of programmes can be understood vs the number of programmes. There is variance in programme sizes, we can see similar programme numbers within nations / regions with a range of programme capacities. There will be a range of reasons for differences, but there may be opportunities to increase learner numbers for existing lower capacity programmes.
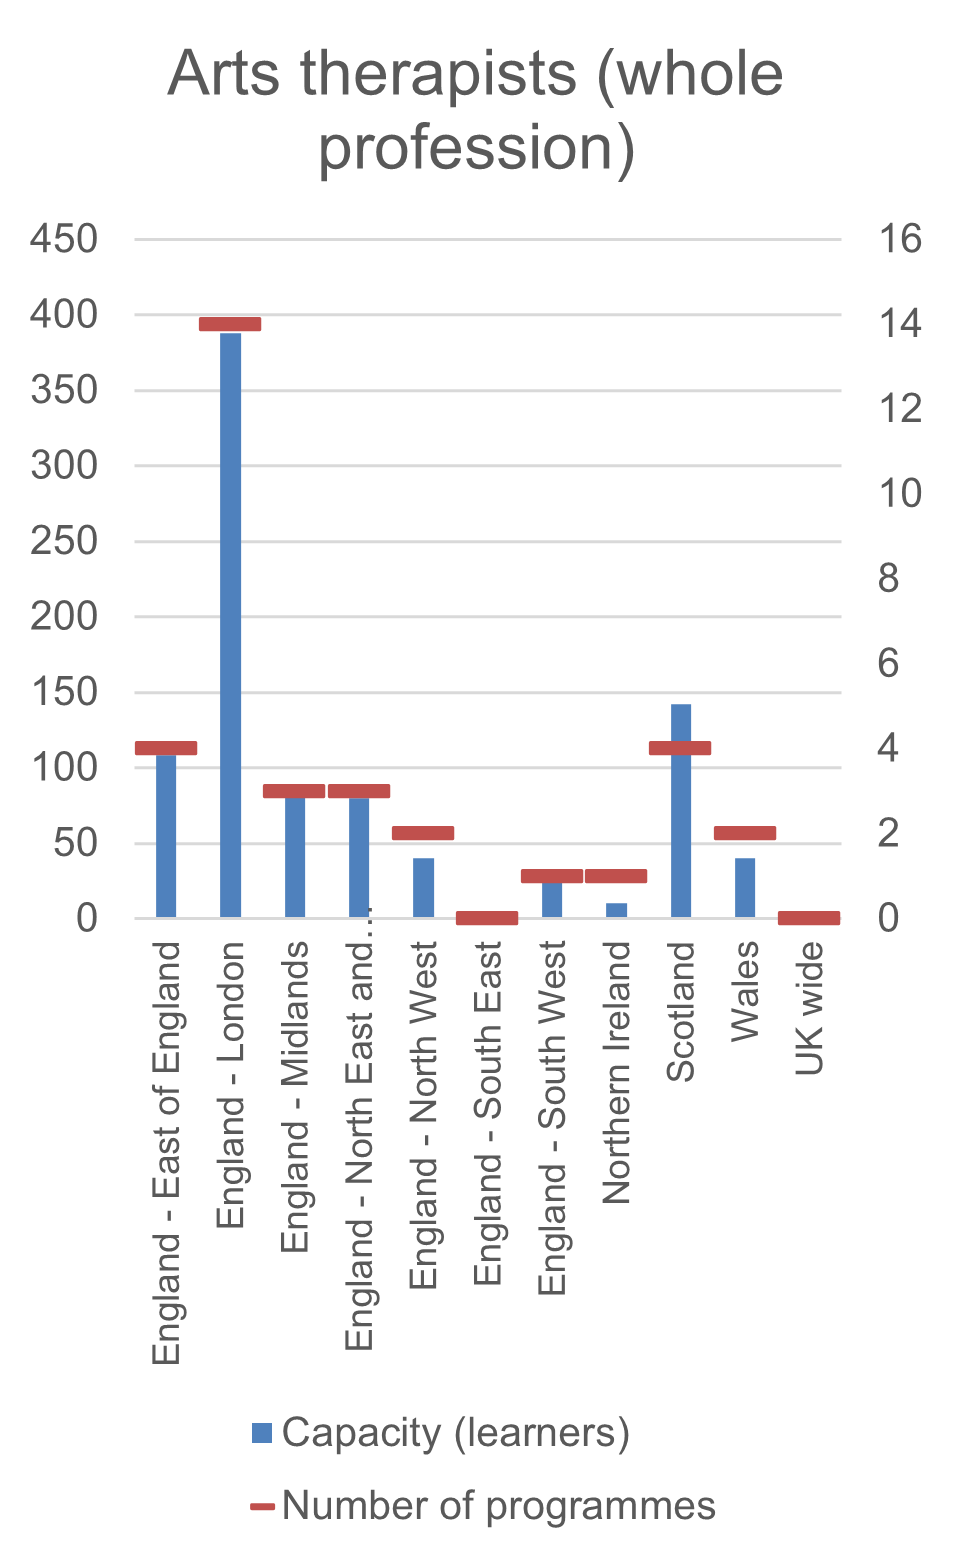
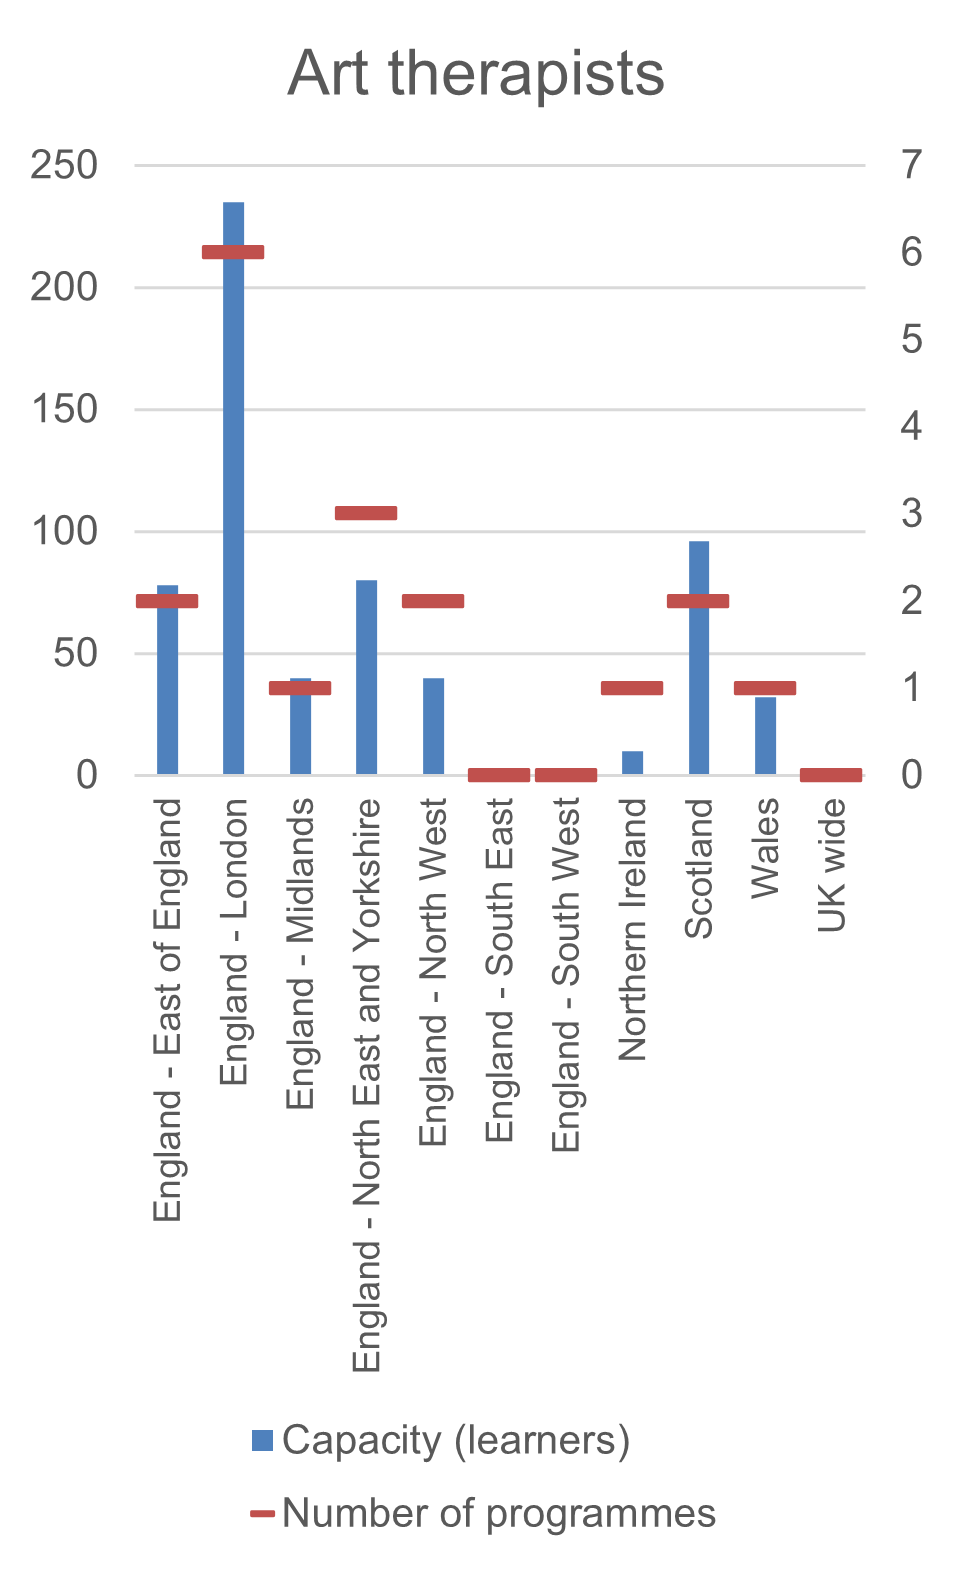
Professions without modalities
Professions with modalities
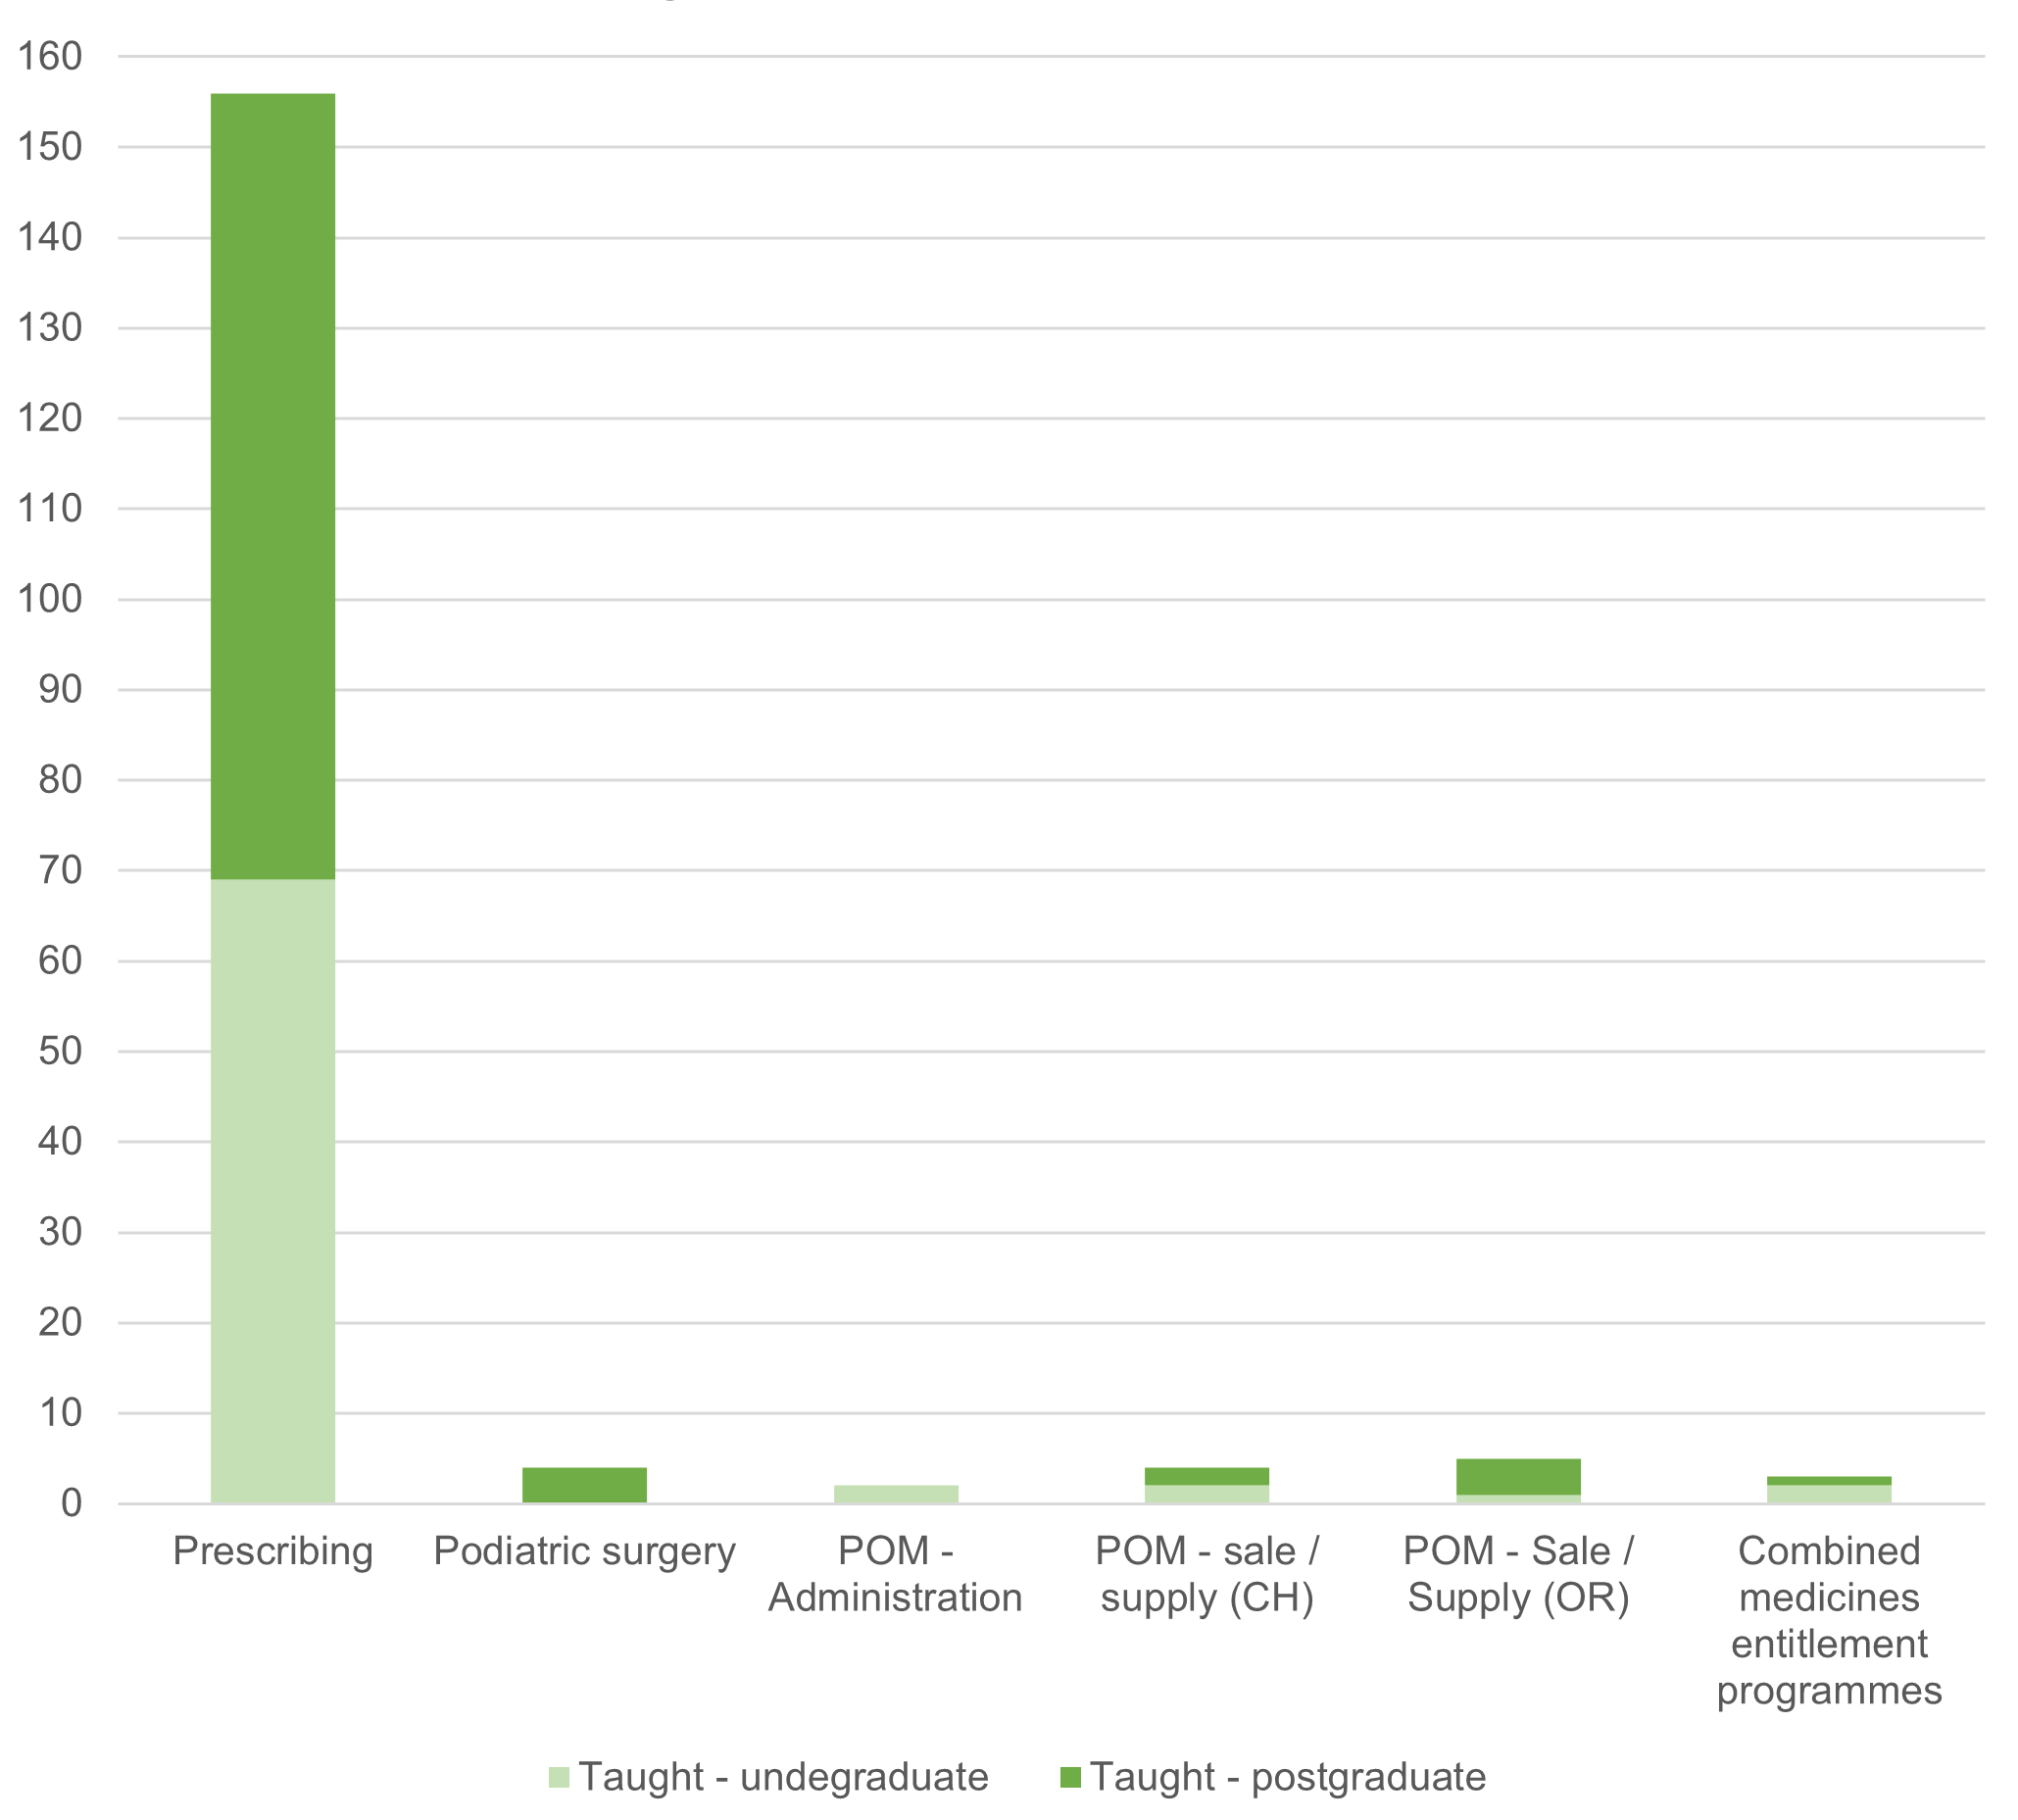
Number of approved post-registration programmes
We also approve post registration programmes, which lead to an ‘annotation’ on our Register. We are required to do this by legislation where a registrant has undertaken additional training linked to medicines and has obtained entitlements to sell, supply, administer or prescribe these medicines. We also annotate for podiatrists practising podiatric surgery, as this is a high level of specialism within the chiropodist / podiatrist profession, and we took the decision that annotating individuals who can practice in this specialist area was essential to protect the public.