Equality, Diversity & Inclusion (EDI) information held by the HCPC with regards to the nine protected characteristics of the Equality Act 2010
This factsheet provides key EDI information for biomedical scientists and how the demographics of this group compare to the demographics of HCPC registrants overall.
Demography:
For age and sex: all current registrants.
For other protected characteristics: all current registrants who have submitted EDI data via the EDI portal or survey:
- 100% of biomedical scientists
- 92% of all professions combined
Period:
As at 17 January 2024.
Diversity data factsheet: biomedical scientists
Expand all
-
Question asked:
"What was your date of birth"
Note:
This was used to calculate current age at the point of production of this factsheet.Biomedical scientists
All professions
Age Count % Count % Not recorded 5 0% 45 0% Recorded 27,540 100% 337,855 100% 20-29 4,115 15% 58,010 17% 30-39 9,020 33% 103,725 31% 40-49 7,395 27% 86,515 26% 50-59 4,855 18% 61,880 18% 60-69 2,000 7% 24,505 7% 70+ 155 1% 3,220 1% 27,540 100% 337,855 100% 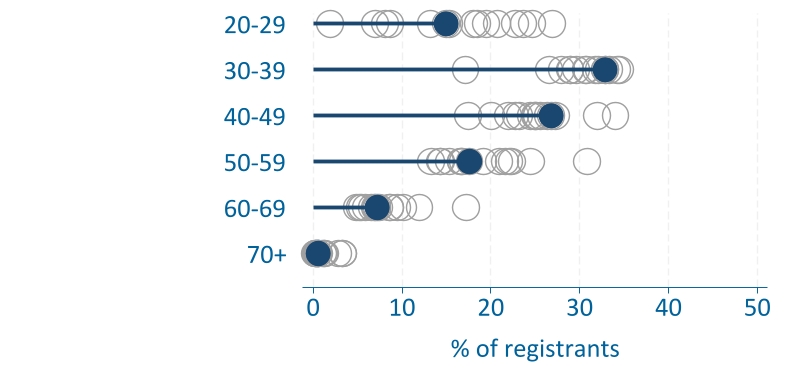
-
Question asked:
"Do you consider yourself to have a disability or to be a disabled person?"
Accompanying note in portal:
In the UK, a disability is defined as "a physical or mental impairment which has a substantial and long-term* adverse effect on a person's ability to carry out normal day-to-day activities" You may have none, one, or more conditions that you believe are covered by this definition. Please answer how you feel this definiton applies to you. (*long-term means that the impact has lasted, or is expected to last, for 12 months or more)
Note:
HCPC does collect further data on long term conditions, however the protected characteristic is disabilty status rather than disabling condition.Biomedical scientists
All professions
Disability Count % Count % Not recorded 0 0% 20 0% Recorded 27,395 100% 311,445 100% No 25,250 92% 283,770 91% Yes 1,060 4% 16,270 5% Prefer not to say 1,085 4% 11,405 4% 27,395 100% 311,445 100% 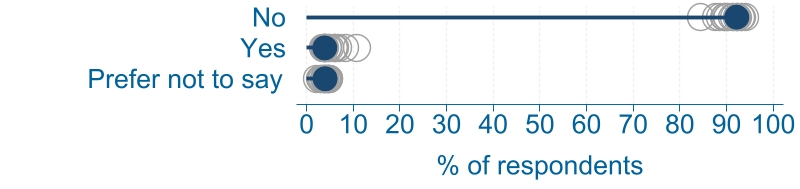
-
Question asked:
"Which of the following best describes your ethnic origin? Ethnicity is defined as including colour, ethnic or national origin, or nationality. Please choose whichever answer best reflects how you think of yourself."
Portal category options:
- White
- Asian or Asian British
- Black, African, Caribbean or Black British
- Mixed or multiple ethnic groups
- Other ethnic group
- Prefer not to say
Note:
The categories presented here are the high level categories collected by HCPC. Respondents are also asked for a lower level category (18 options) based on their high level response.Biomedical scientists
All professions
Ethnicity Count % Count % Not recorded 0 0% 0 0% Recorded 27,390 100% 311,475 100% White 15,080 55% 234,985 75% Asian 4,995 18% 36,525 12% Black 4,885 18% 17,050 5% Mixed 490 2% 6,220 2% Other 650 2% 4,305 1% Prefer not to say 1,290 5% 12,390 4% 27,390 100% 311,475 100% 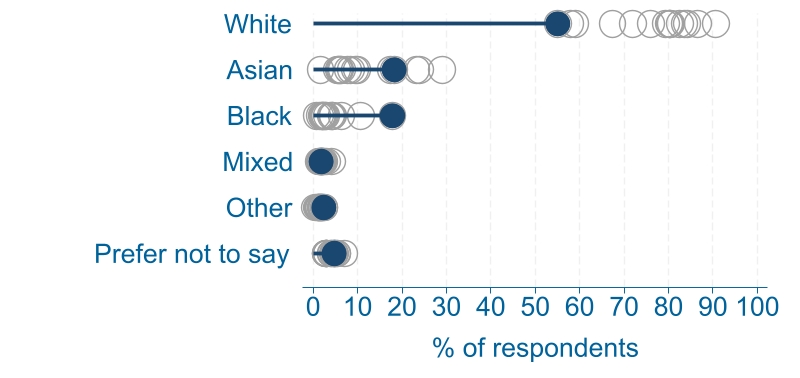
-
Question asked:
"Is the gender you identify with the same as your sex registered at birth?"
Accompanying note in portal:
Your gender identity may be the same as your assigned sex, but it may be different. You may identify as the opposite gender to your assigned sex, you may identify with neither, or with a self-described gender identity.Biomedical scientists
All professions
Gender Reassignment Count % Count % Not recorded 10 0% 210 0% Recorded 27,385 100% 311,260 100% Yes 26,395 96% 300,295 96% No 70 0% 735 0% Prefer to self-describe 20 0% 305 0% Prefer not to say 900 3% 9,925 3% 27,385 100% 311,260 100% 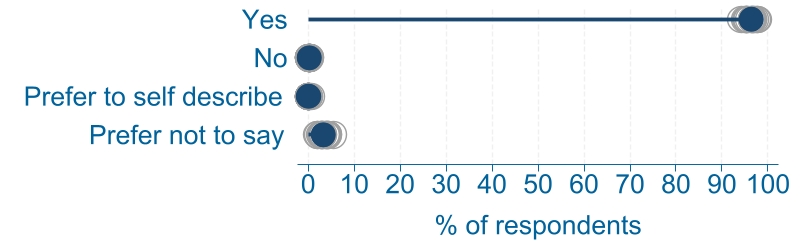
-
Question asked:
"What is your legal marital or registered civil partnership status?"
Portal category options:
- Married
- Never married and never registered in a civil partnership
- Divorced
- In a registered civil partnership
- Separated but still legally married
- Widowed
- Formerly in a civil partnership which is now legally dissolved
- Separated but still legally in civil partnership
- Surviving partner from a registered civil partnership
- Prefer not to sayBiomedical scientists
All professions
Marriage and Civil Partnership Count % Count % Not recorded 0 0% 25 0% Recorded 27,400 100% 311,445 100% Married (M) 13,975 51% 150,850 48% Never married or CP 9,100 33% 110,000 35% Separated & div. (M) 1,255 5% 16,450 5% In Civil Partnership (CP) 115 0% 1,870 1% Separated, not div. (M) 375 1% 4,245 1% Widowed (M) 225 1% 2,075 1% Separated & dis. (CP) 10 0% 200 0% Separated not dis. (CP) 15 0% 135 0% Widowed (CP) 5 0% 40 0% Prefer not to say 2,325 8% 25,580 8% 27,400 100% 311,445 100% 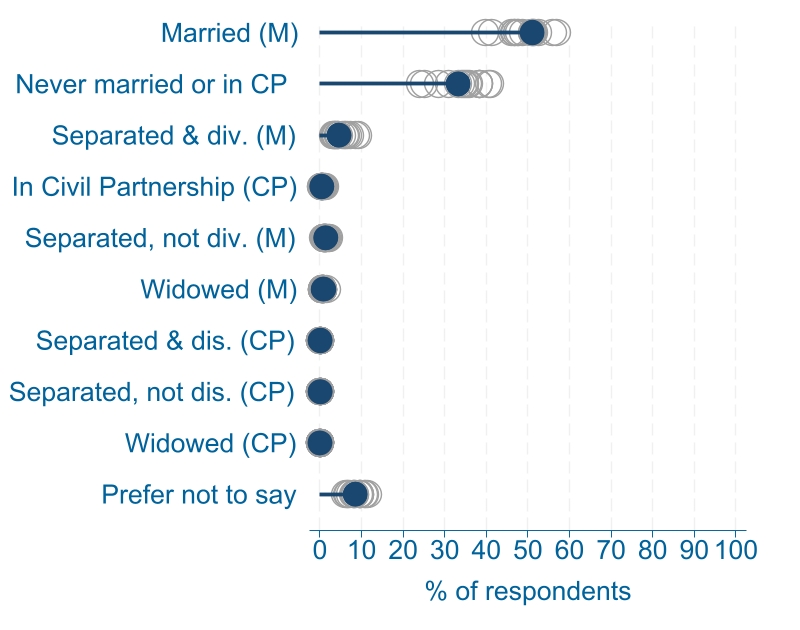
-
Question asked:
"Do you consider your self to fall under the protected characteristic of 'pregnacy & maternity', as per the Equality Act 2010? 'Pregnancy' refers to the condition of being pregnant or expecting a baby, and 'maternity' refers to the period of 26 weeks after birth. The Equality Act 2010 protections also cover a someone who has had a miscarriage."Biomedical scientists
All professions
Pregnancy and Maternity Count % Count % Not recorded 5 0% 95 0% Recorded 27,390 100% 311,370 100% No 24,245 89% 276,980 89% Yes 1,370 5% 15,810 5% Prefer not to say 1,775 6% 18,580 6% 27,390 100% 311,370 100% 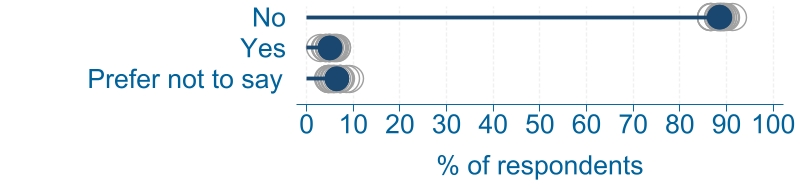
-
Question asked:
"What is your religion or strongly held belief, if any?"
Portal category options:
- No religion or strongly held belief
- Christian (Including Church of England, Catholic, Protestant and all other Christian denominations.)
- Muslim
- Hindu
- Spiritual
- Buddhist
- Any other religion or belief
- Jewish
- Sikh
- Prefer not to sayBiomedical scientists
All professions
Religion or Belief Count % Count % Not recorded 0 0% 15 0% Recorded 27,380 100% 311,460 100% No religion 8,830 32% 128,260 41% Christian 11,475 42% 120,025 39% Muslim 2,825 10% 14,885 5% Hindu 1,240 5% 9,130 3% Spiritual 265 1% 5,810 2% Buddhist 175 1% 2,285 1% Other 130 0% 1,920 1% Jewish 25 0% 1,785 1% Sikh 280 1% 1,600 1% Prefer not to say 2,135 8% 25,760 8% 27,380 100% 311,460 100% 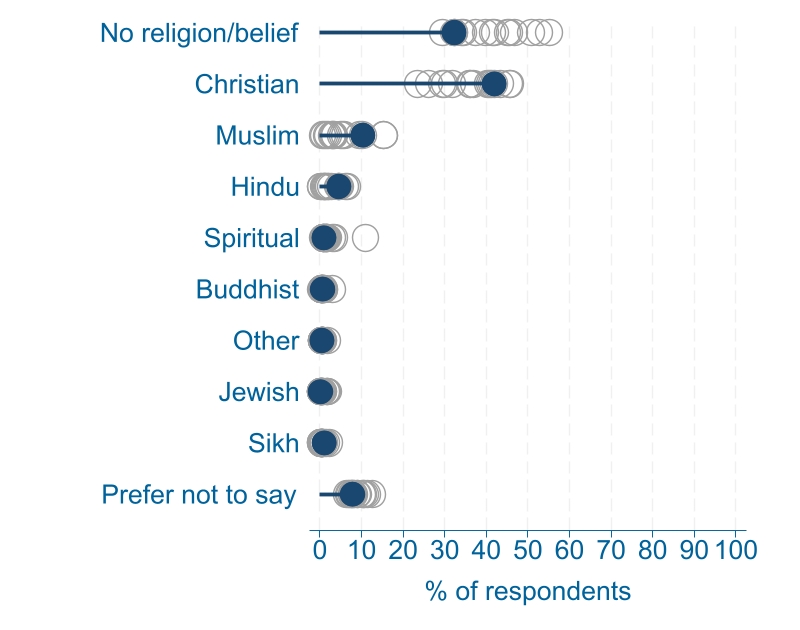
-
Question asked:
"What is your Sex?"
Accompanying note in portal:
This is the sex you were assigned at birth and we asked you to provide this information when you registered with the HCPC. For births registered in the UK, this will either be male or female. However, some other countries may include 'intersex' as an option. We also ask if your gender identity is different from the sex you were assigned at birth. Your gender identity may be the same as your assigned sex, but it may be different. You may identify as the opposite gender to your assigned sex, you may identify with neither, or with a self-described gender identity.Biomedical scientists
All professions
Sex Count % Count % Not recorded 0 0% 35 0% Recorded 27,545 100% 337,870 100% Female 18,335 67% 241,060 71% Male 8,405 31% 88,005 26% Intersex 0 0% 45 0% Prefer not to say 805 3% 8,760 3% 27,545 100% 337,870 100% 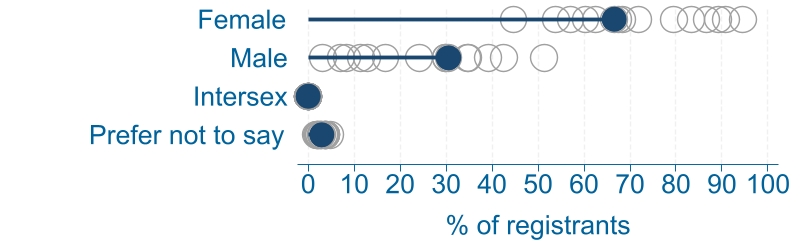
-
Question asked:
"Which of the following best describes your sexual orientation?"
Portal category options:
- Heterosexual/straight
- Bisexual
- Gay woman/lesbian
- Gay man
- Pansexual
- Queer
- Asexual
- Prefer to self-describe
- Prefer not to sayBiomedical scientists
All professions
Sexual Orientation Count % Count % Not recorded 0 0% 15 0% Recorded 27,395 100% 311,455 100% Heterosexual 23,985 88% 270,395 87% Bisexual 470 2% 5,850 2% Lesbian 200 1% 4,200 1% Gay man 400 1% 3,765 1% Pansexual 65 0% 930 0% Queer 45 0% 820 0% Asexual 55 0% 300 0% Prefer to self-describe 10 0% 225 0% Prefer not to say 2,165 8% 24,970 8% 27,395 100% 311,455 100% 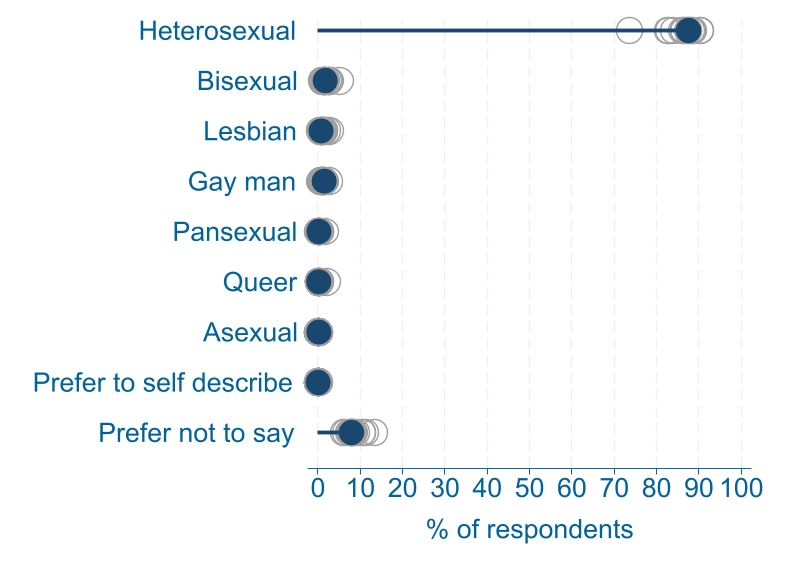
Help and guidance
Protected characteristics: The nine protected charateristics of the Equality Act 2010: Age, disability, ethnicity, gender reassignment, marriage and civil partnership, pregnancy and maternity, religion or belief, sex, sexual orientation.
Registrants: An active registrant on the HCPC register at the time of the analysis.
Respondents: Registrants who provided other protected characteristic EDI data via the portal or survey.
Count: Number of registrants (age & sex) or respondents (other protected characteristics).
Not recorded: Total number of registrants/respondents for whom this information is not held. For respondents these are due to data collection system errors and only includes those who have attempted to give this information.
Recorded: Total number of registrants/respondents for whom this information is held.
All professions
Age & Sex: All active registrants on the HCPC register, regardless of profession.
Other protected characterictics: All respondents of EDI regardless of profession.
Supply of EDI data is voluntary and therefore is not complete for all registrants. As such the tables do not represent the entire register. Consideration of the coverage as detailed in the Demography section is important when using or generalising the findings.
Most registrants complete or update their EDI data at renewal, so it may be up to two years old.
All questions have a "prefer not to say" option which are included in the tables as it is a valid response and hence indicates that the question has been asked.
A small number of records were been affected by now resolved issues with the data collection systems that allowed no reponse to be recorded for certain questions. These are shown as 'Not recorded' in the tables.
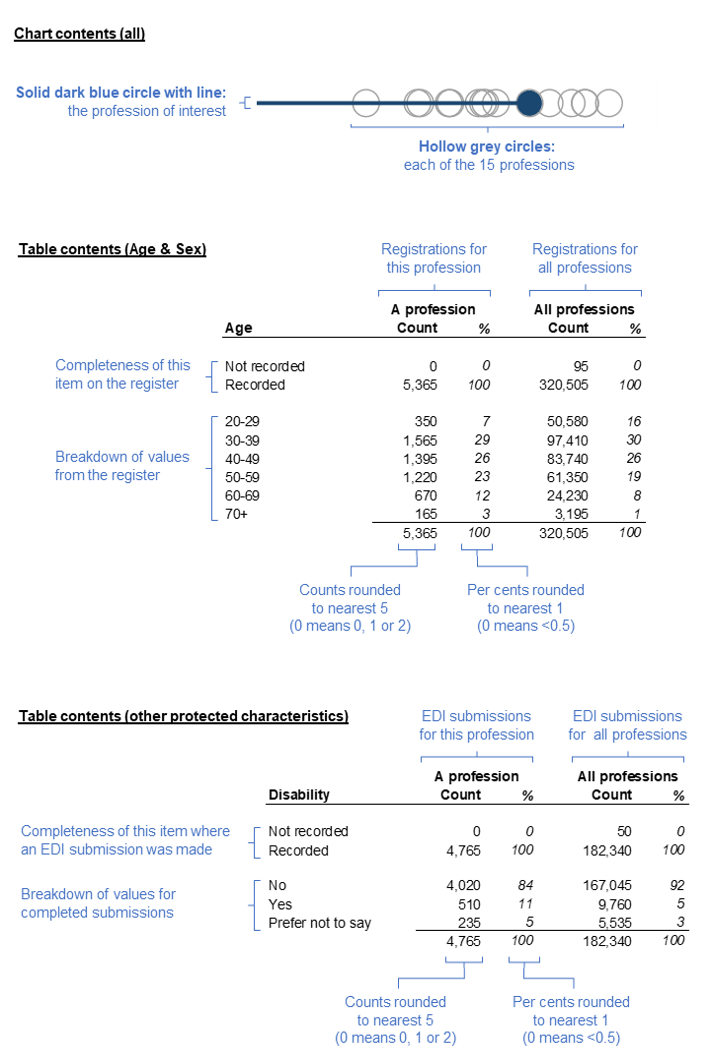
Rounding has been used to control the risk of disclosure of personal information. Counts have been rounded to the nearest five. Therefore a count of 0 in a table represents either 0, 1 or 2 registrants with that characteristic.
- Published:
- 18/03/2024
- Resources
- Data
- Subcategory:
- Registrant data, Diversity data
- Profession
- Biomedical scientists