Snapshot of outcomes related to the HCPC’s education function for the 2019-20 academic year
The data set
The education annual data set includes data the following areas of our work:
- Approved programmes at academic year end
- Approval process
- Major change process
- Annual monitoring process
- Concerns process
All figures gathered for each section relate to work where we carried out an assessment of a programme in the 2019-20 academic year. This means we have adjusted all final outcomes to include those which were finalised in the following academic year (due to timing of the assessment carried out).
Most sources of data count assessments carried out on an individual programme basis (rather than at case level, which in some cases, groups more than one programme within the one assessment).
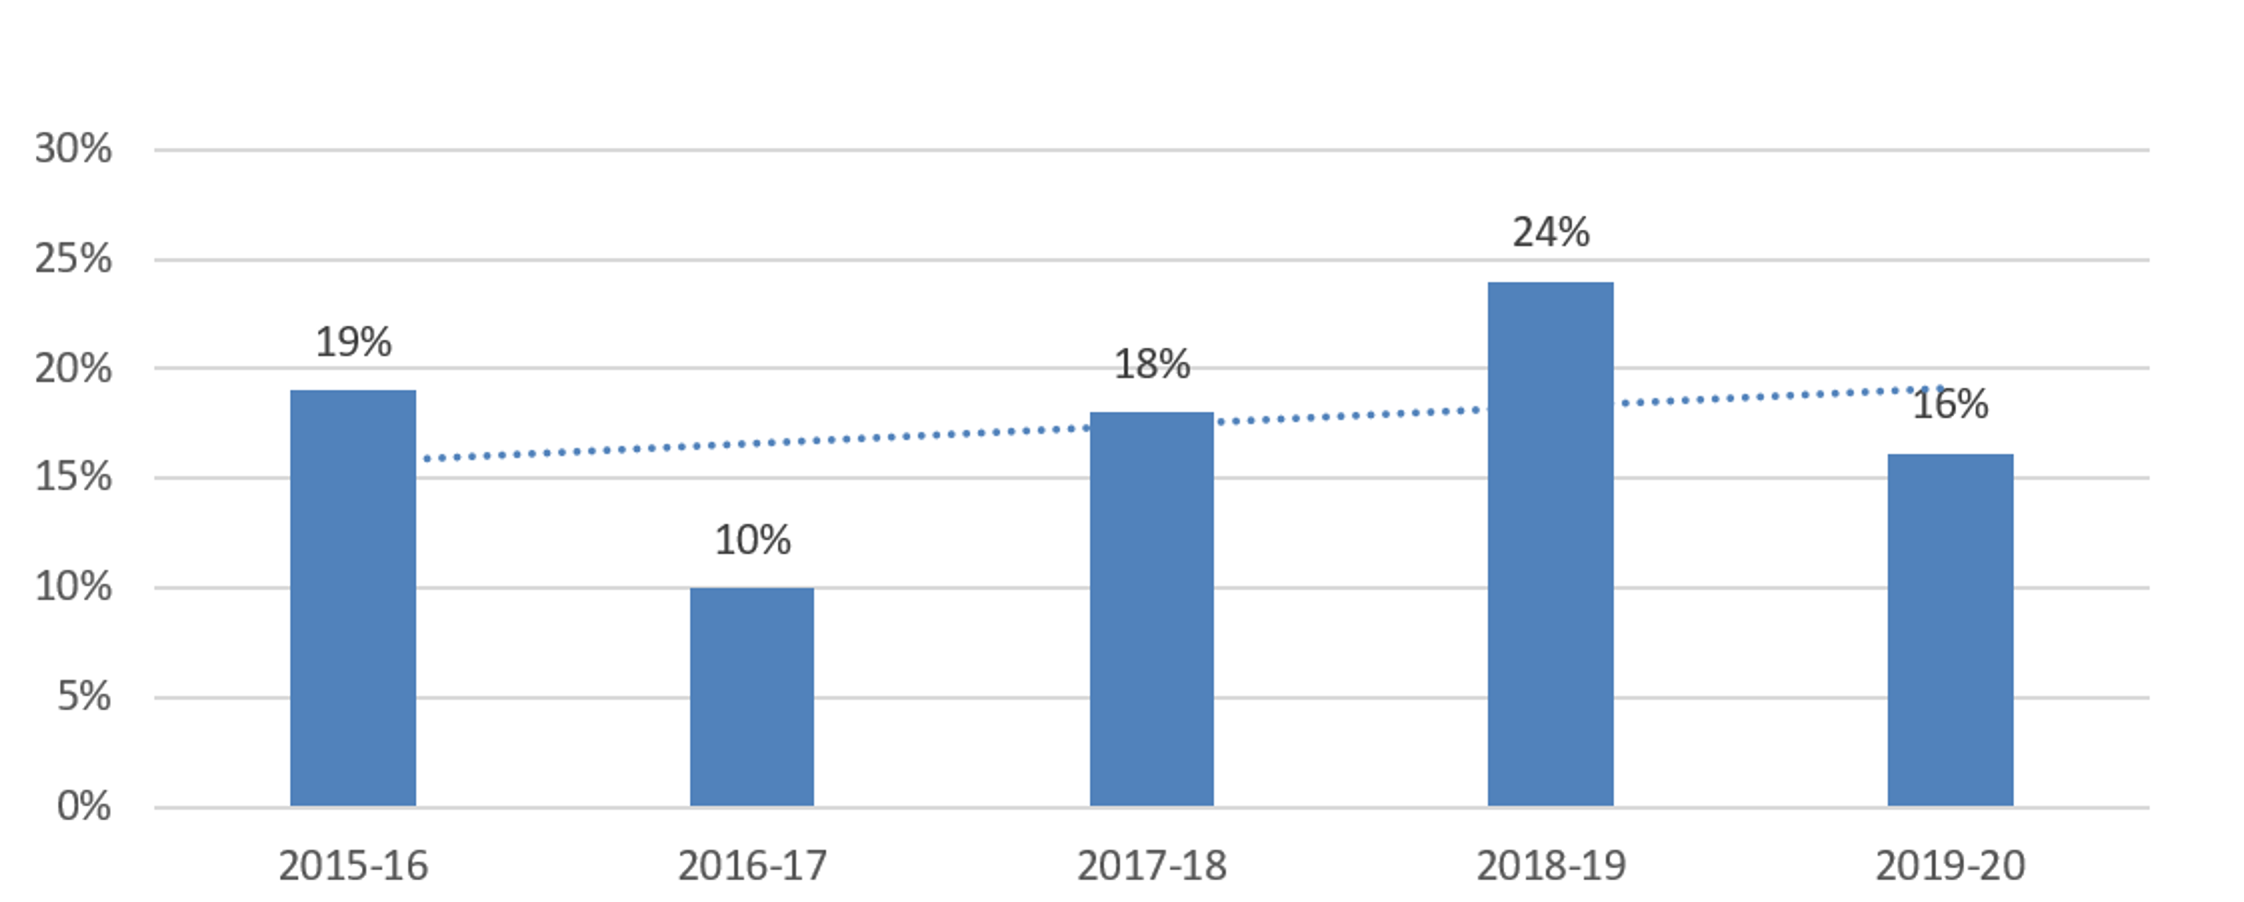
Approved programmes at academic year end
Our overall rate of new programme generation decreased to 19 per cent in this period, factoring in the removal of Social Work programmes from the records as well as programme closures. This is in contrast to the average increase / decrease seen over the previous four years.
| Changes in approved programme numbers between years | Changes in approved programme numbers between years (excluding Social Work programmes) | |
| 2015-16 | -2.2% | -2.5% |
| 2016-17 | 0.9% | 1.4% |
| 2017-18 | 5.2% | 6.4% |
| 2018-19 | 6.1% | 5.3% |
| 2019-20 | -18.8% | 5.9% |
Despite the overall decrease in the number of approved programmes due to the transfer of social workers, we still see an increase in programme generation across a number of professions. Further analysis of new programme generation is included within the approval process section. However, broadly speaking key developments influencing this result include:
- Degree apprenticeships in England
- Diversification of higher education provision through regulatory / policy changes in England
- The introduction of new BSc Paramedic programmes in Scotland
HEFCE funded training models implemented in England, providing more incentive for new providers - Changes to requirements and process to obtain degree awarding powers in England, meaning more private providers delivering qualifications at degree level and above
- The revised threshold qualification level for paramedics moving to degree, triggering more degree level proposals
- Workforce planning indicating shortages for some professions, leading to more initiatives to incentivise provision of training and increases in training numbers
- Vulnerable professions identified, with specific measures to commission training places, and the identification of new training routes
- Medicines entitlements changes for some professions (Prescribing rights and medical exemptions)
It is important to note the overall programme growth (factoring out social work) has been achieved within the context of the COVID-19 pandemic. This means despite all the challenges faced by the sector during this period, the drivers for new programmes remain strong. Our decision to change to a virtual model of approvals has also played its part in ensuring education providers can achieve approval with us.
Approval process
Reasons for visiting programmes
We visited programmes from 12 of the 15 professions we regulate. The top nine professions and practice areas highlighted below reflect a broader trend of sector developments having impacts across a number of professions, leading to new programmes and significant changes to those already approved with us.
Most visited programmes by profession and reason for visit
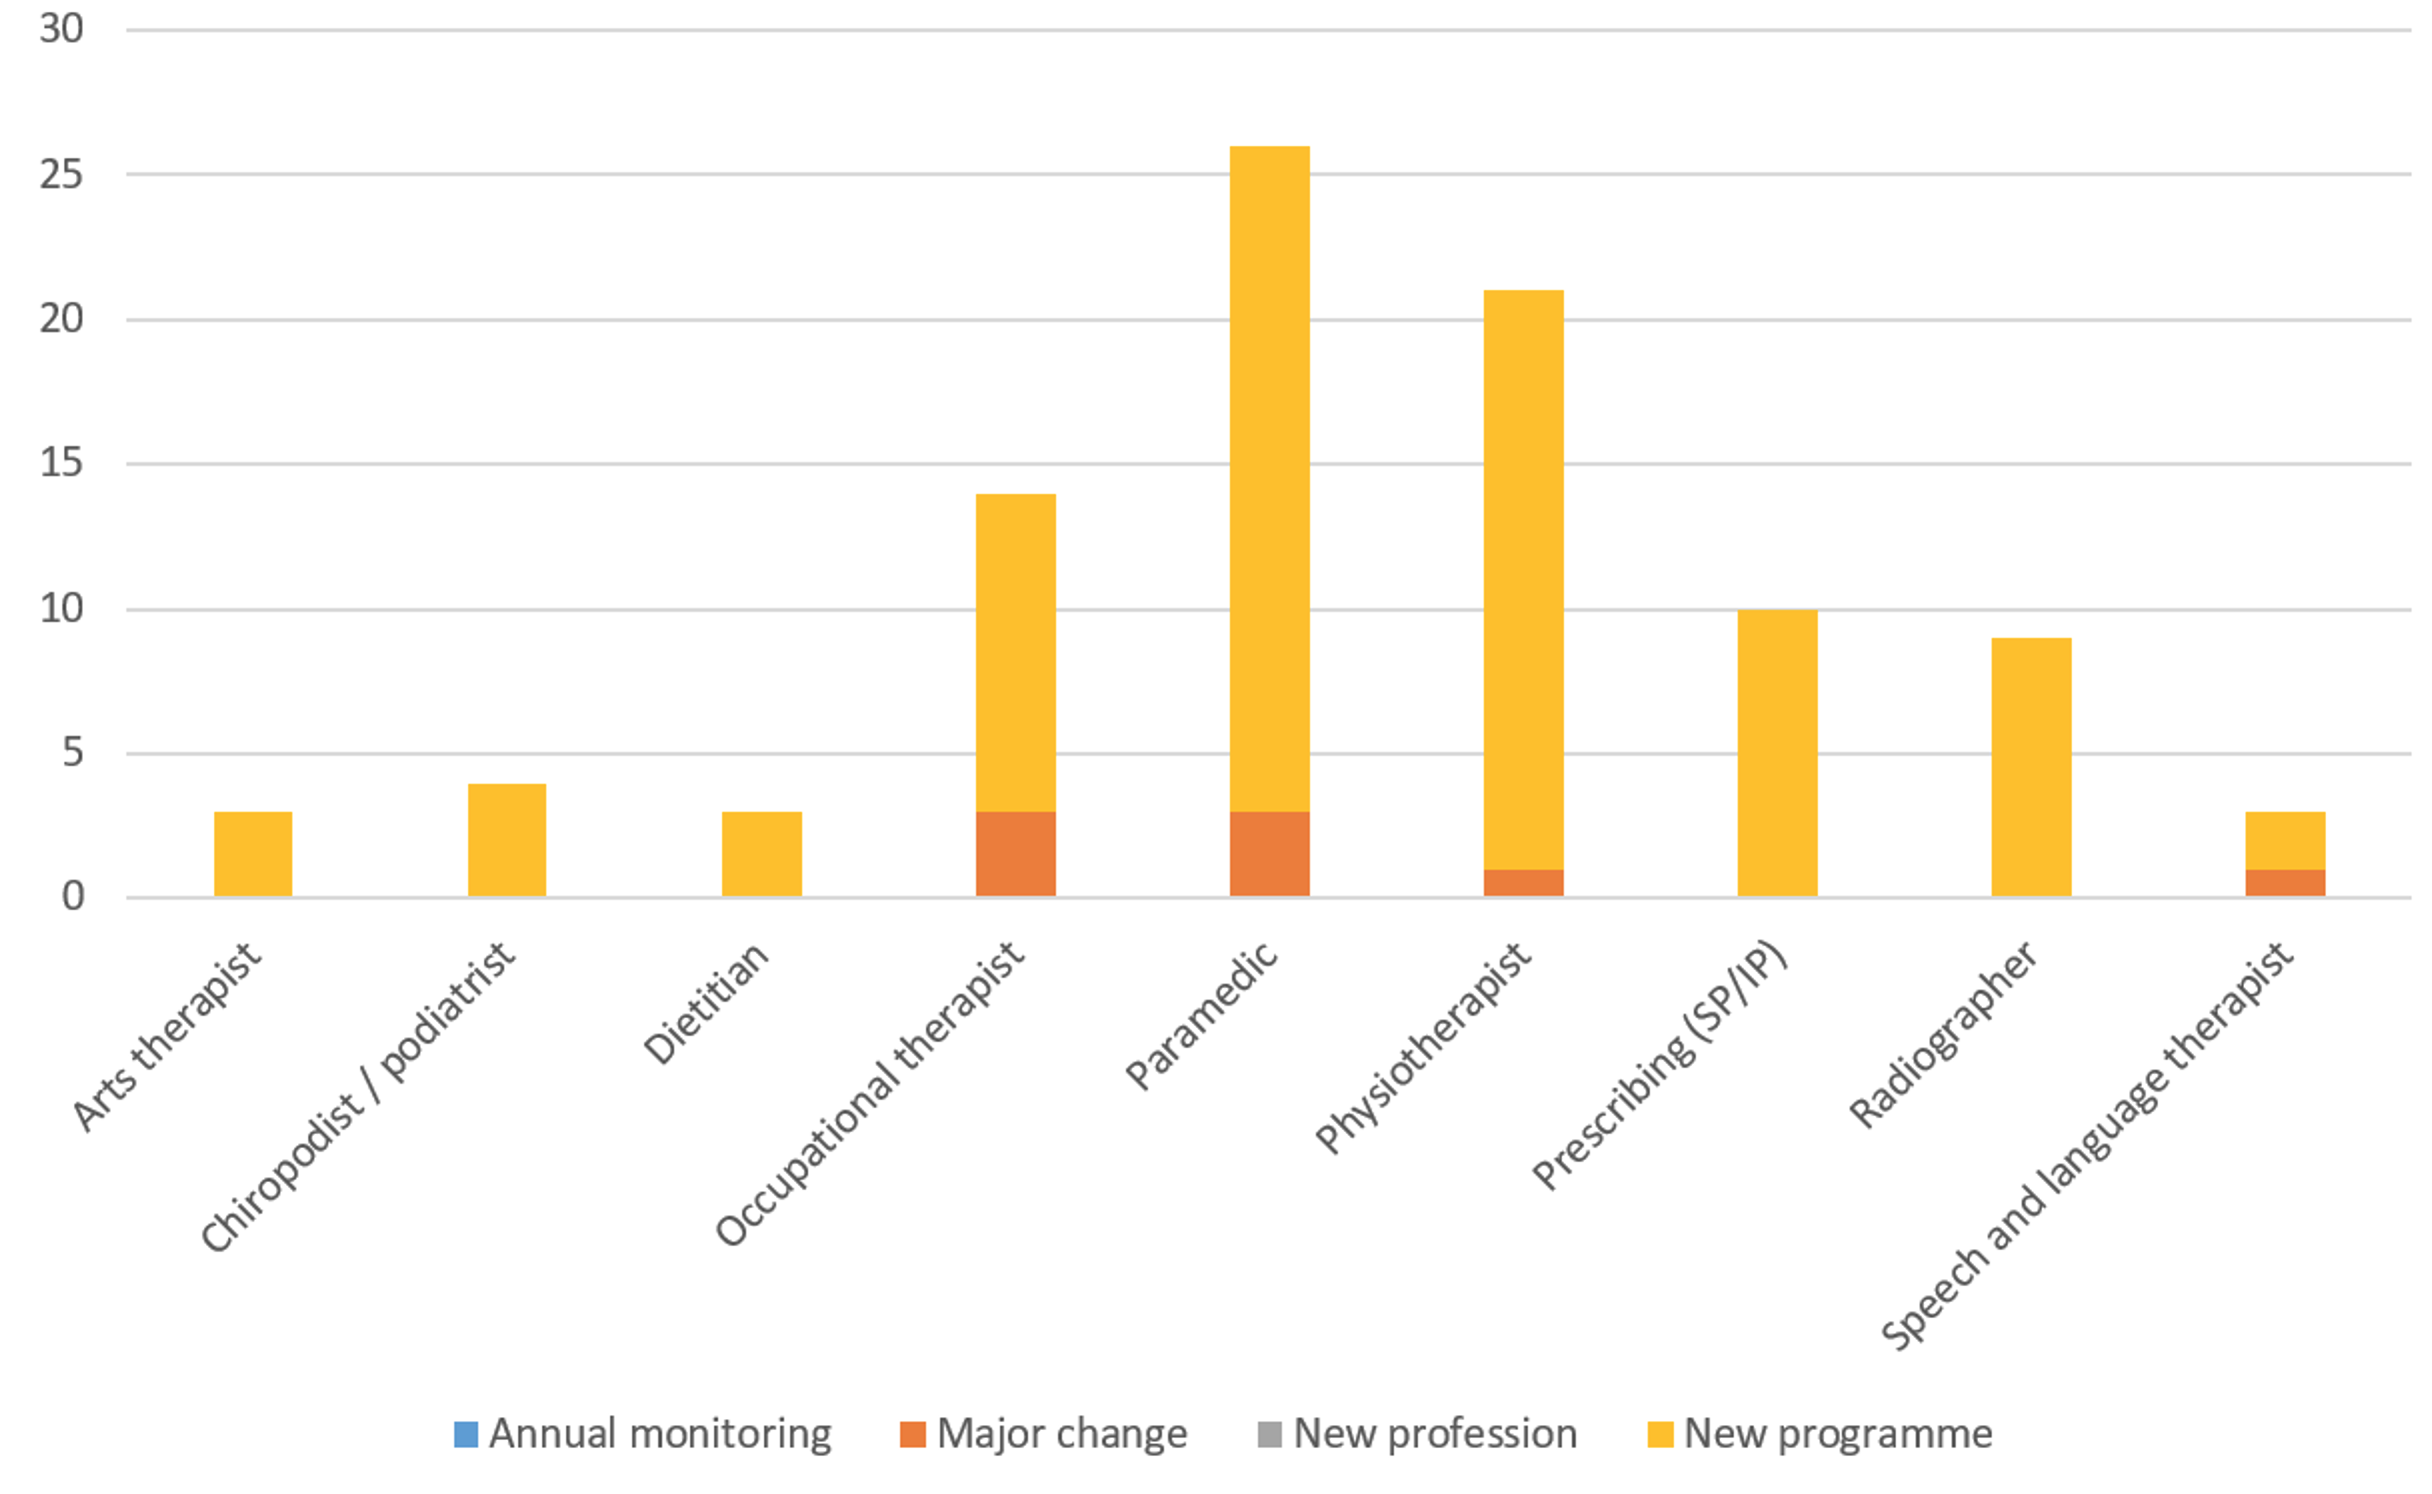
Following the transfer of the regulation of Social workers in England to another regulator, Paramedic, Physiotherapy and Occupational Therapy programmes continue to generate high levels of new programme approval activity, a trend which continues on from the previous period.
For paramedics, the impact of raising the threshold level of qualifications for paramedics continues to be seen in the level of new degree programme activity and triggered visits from major change. We expect this trend to continue as we move closer to the September 2021 deadline for the profession being degree level entry only. Alongside new programme generation related to degree level training, increase can also be attributed to the new BSc (Hons) degrees approved across four different education providers in Scotland.
The extension of independent and supplementary prescribing rights to a wider range of allied health professions continues to account for a growth in programmes being offered. The multidisciplinary nature of the programmes is becoming more diverse as we see a rise in education providers offering these programmes to more AHPs who train alongside nursing professionals and pharmacists. Additionally, we also see a number of new independent and supplementary prescribing programmes with POM- Sale/Supply entitlements being offered.
The transfer of statutory regulation of Social workers in England to another regulator has also led to a significant reduction in the number of degree apprenticeships that are being approved. Compared to the 2017-18 and 2018-19 academic years where we received a total of 29 and 53 requests respectively to approve degree apprenticeships, there were only 8 requests received during the 2019-20 academic year.
Time taken to complete the approval process
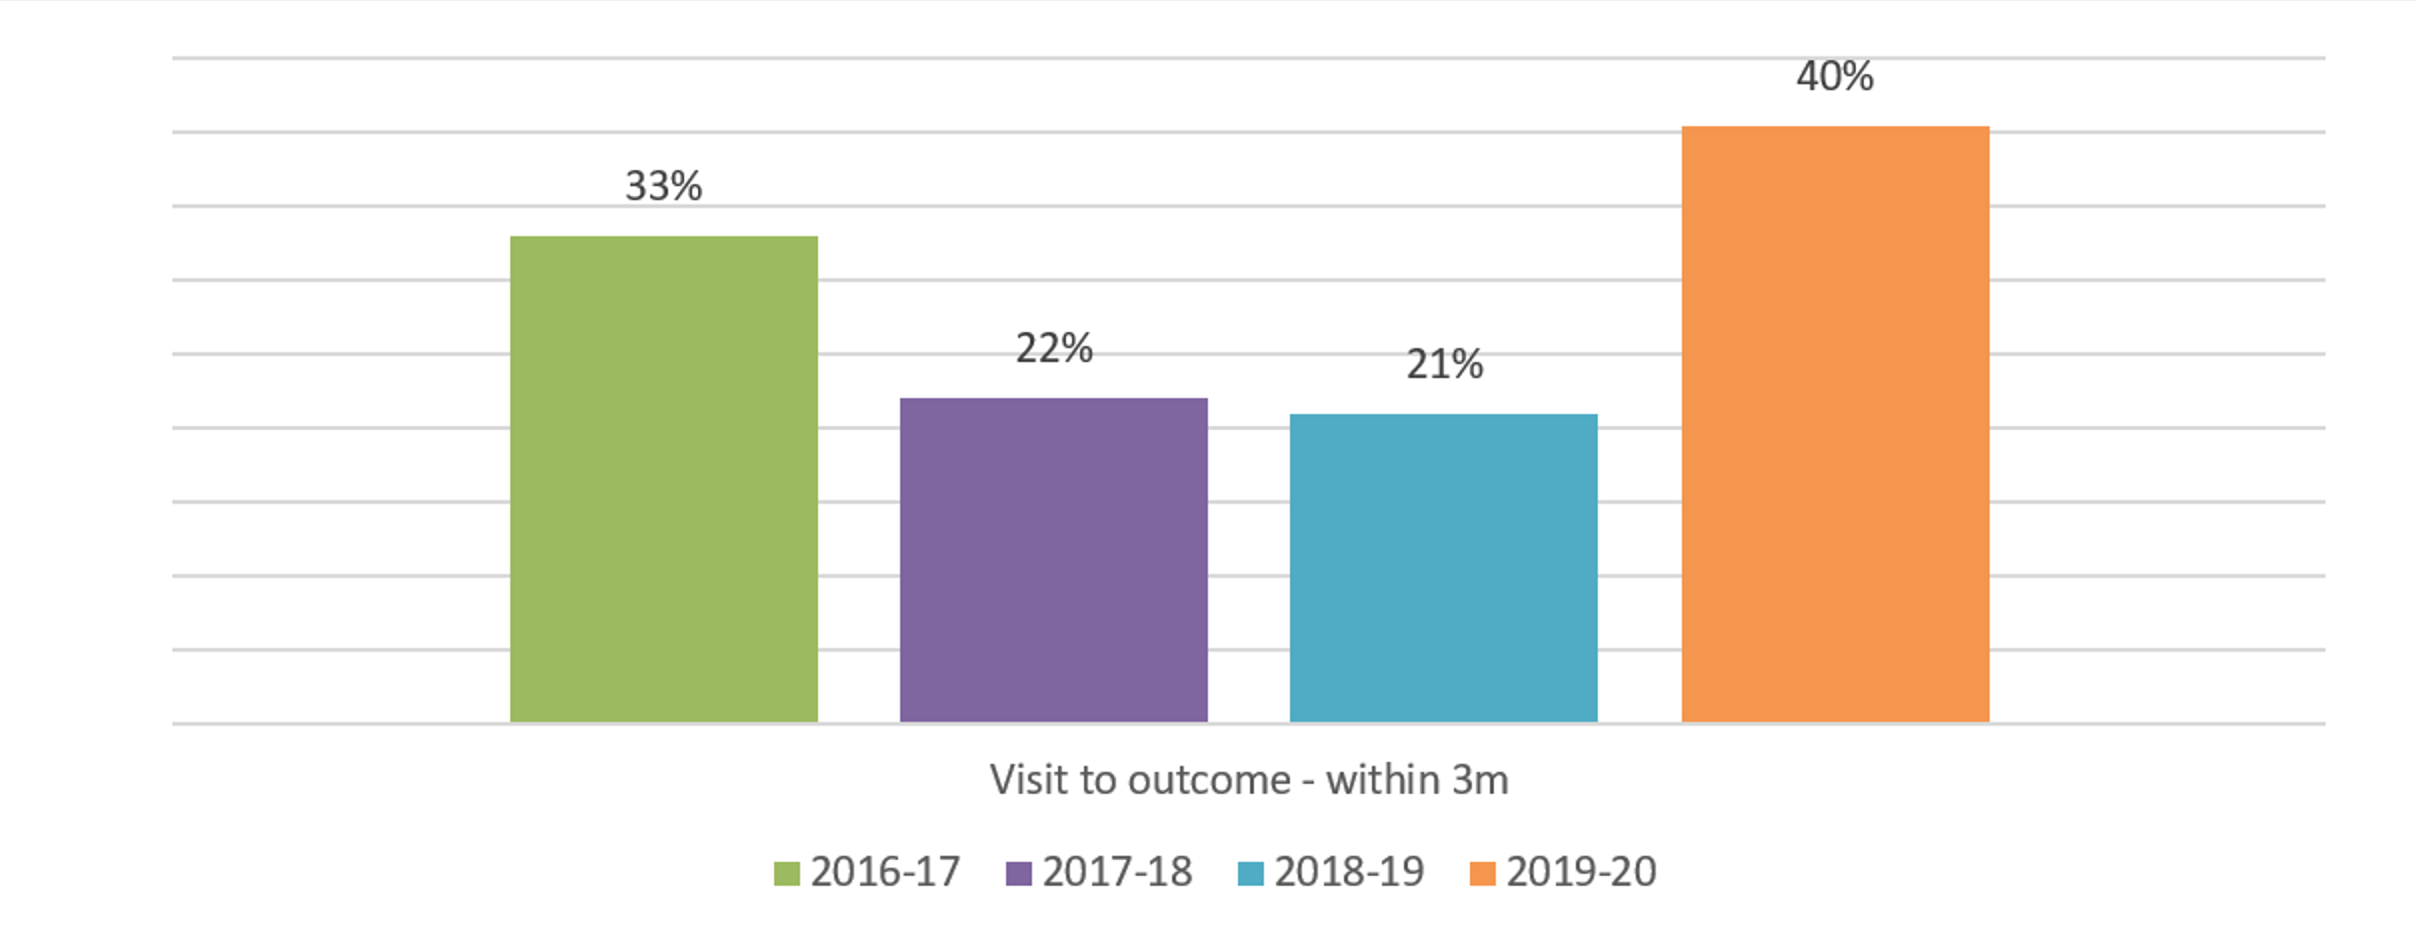
Compared to the last 3 years, this year, we see a decrease in the length of the post-visit process with 40 per cent of programmes completing the process within three months of the visit concluding.
Visit to final outcome within 3 months
Factors influencing this outcome include:
- more programmes being approved without any conditions;
- fewer programmes requiring second condition; and
- a slight reduction in the length of time required by education providers to submit their first conditions response.
Although we aim for conditions response deadline to be set around six weeks after the visit, we continue to see education providers needing around 2.1 months to provide their first response to conditions set at approval, with a slight reduction to around 2.05 this year. This is usually negotiated on a case by case basis, factoring the nature and complexity of conditions being set.
Average time between visit date and conditions deadline
Due to the complexity in programmes being considered, which also accounts for the complexity in the nature of some of the conditions, it has been taking longer to produce visitors’ reports. This year, we see a 5 per cent increase over the last four years. This prolonged length of time could also be linked to the increase in the number of new programmes being approved this year.
Days taken for education provider to receive visitors’ report
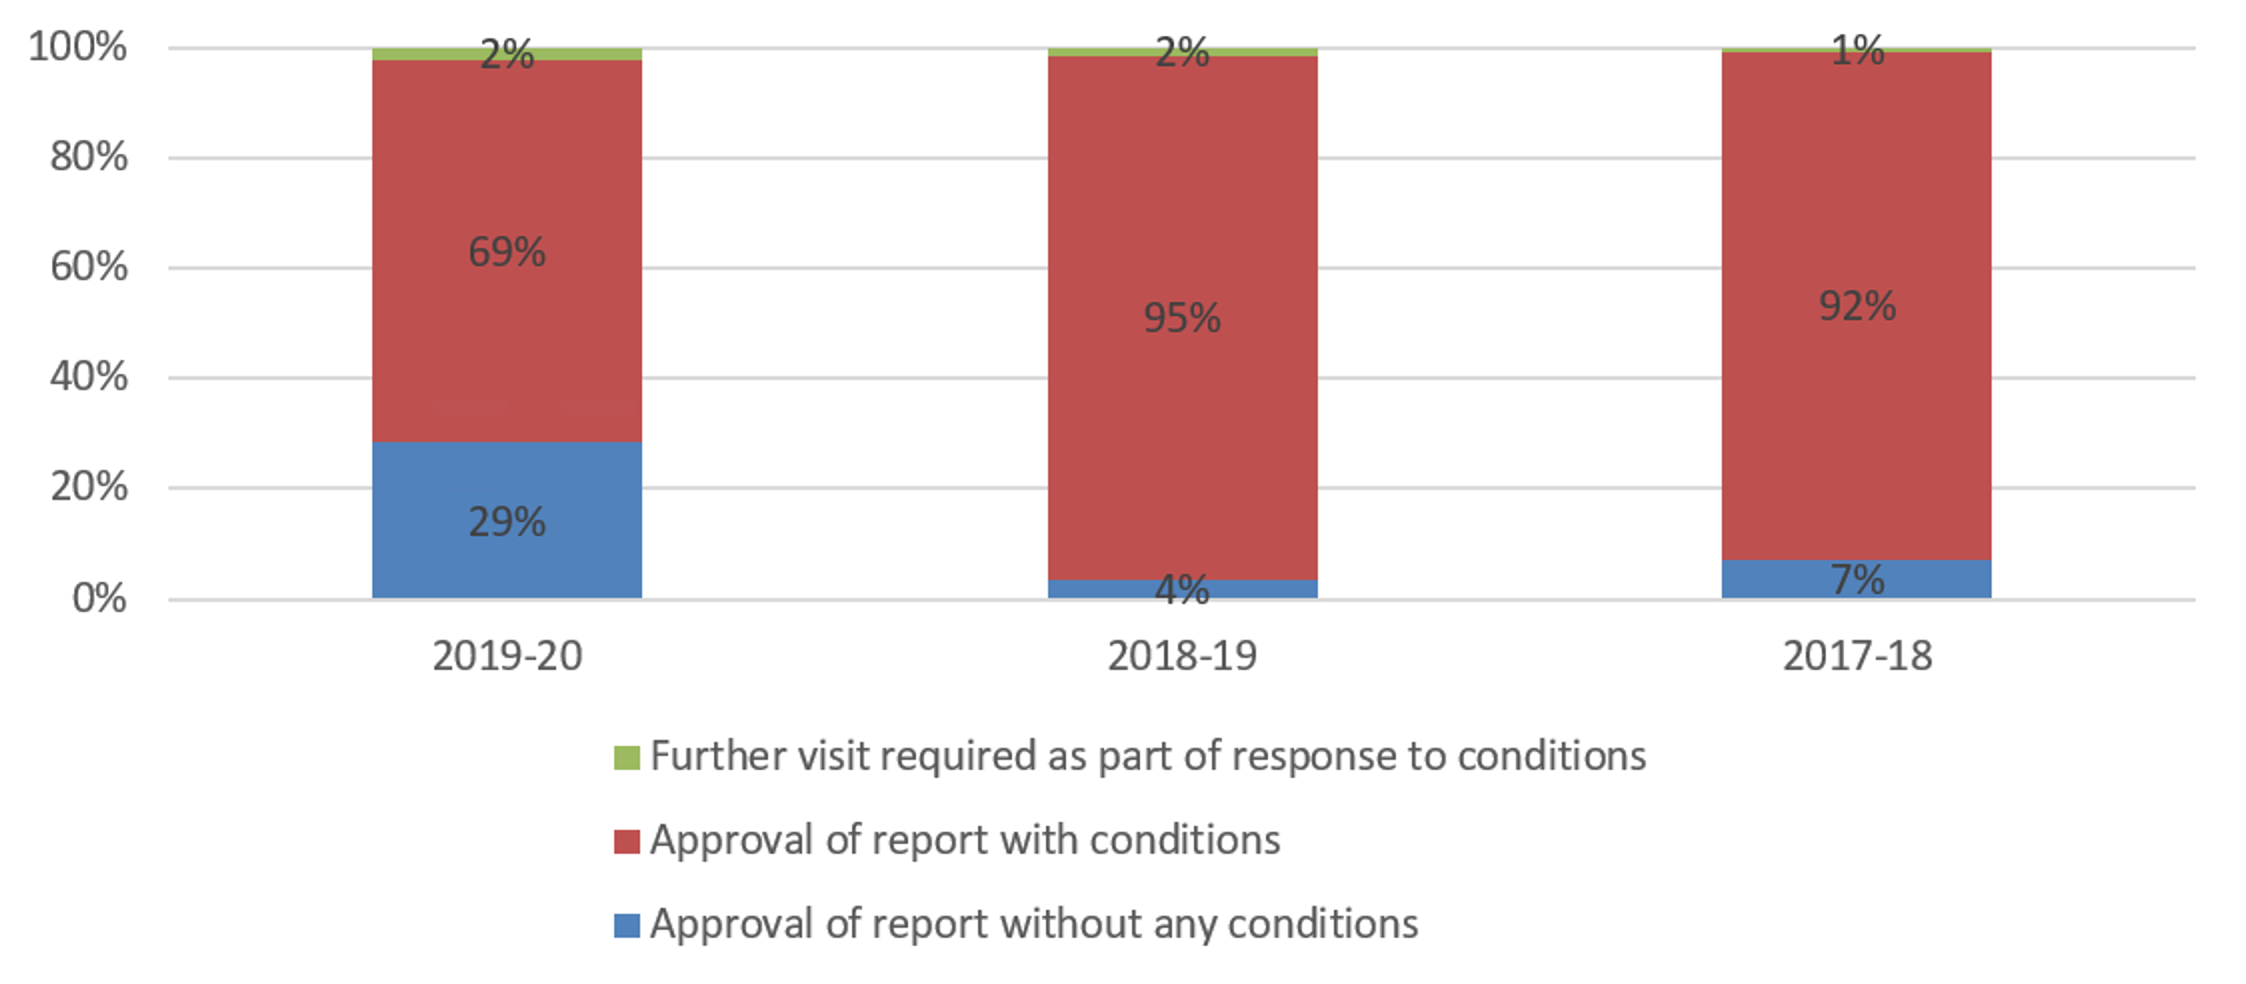
Outcomes reached
Compared with the last two years which had 7 per cent (2017-18) and 4 per cent (2018-19) approval of report without conditions, we see 29 per cent of reports were approved without conditions this year. We attribute this result in part to the introduction of the New Profession /Provider (NPP) pathway providing better visit outcomes.
Summary of visitor recommendations following approval visit
It is worth noting that this year, there were no non-standard outcomes (Non-approval of a new programme/ withdrawal of approval from a currently approved programme) both at visitors’ recommendation and ETC decision stages. This is a very good outcome compared to last year where five new programmes had non-approval recommendation by visitors at the conclusion of the approval process. This was however down to one programme at ETC decision made at conclusion of approval process.
As seen from the results this year, the NPP pathway which was introduced midway through the last academic year continues to have a positive impact on visit outcomes by assisting in minimising the number of conditions on approval, and visit outcomes which lead to non-standard outcomes. The process has assisted education providers in particular, in managing the complexities of new programme delivery through the approval process and ensuring significant issues are identified and addressed as early as possible.
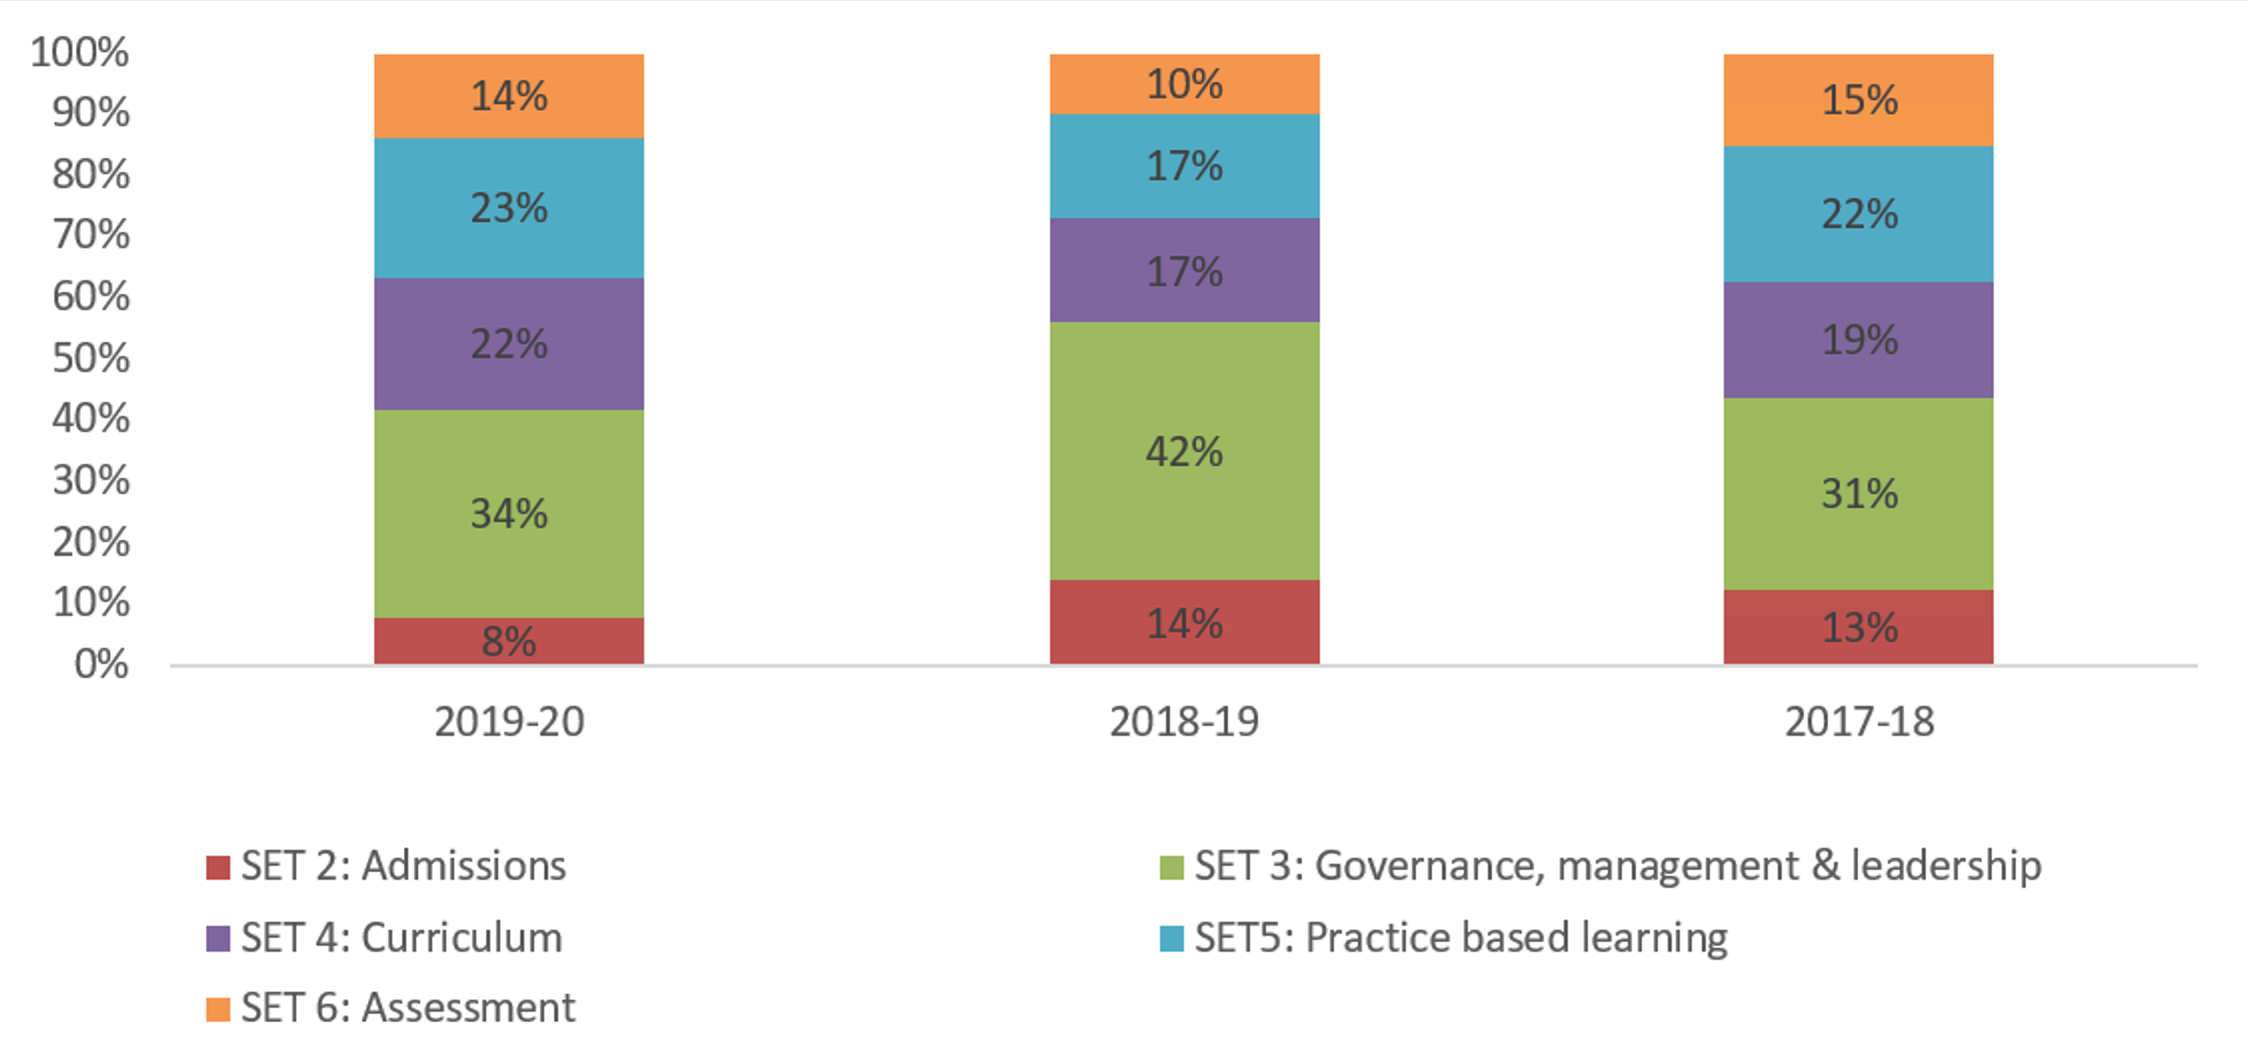
Conditions
We see a rise in the number of conditions set around SET 4- Programme design and delivery compared to the last two years. This year, a total of 22% of all conditions set were around SET 4, this is in comparison with 2018-19 and 2017-18 where we had 17% and 19% respectively. Further analysis shows that the most number of conditions were around SET 4.1. This could imply gaps in the development of the curriculum where education providers have not demonstrated curriculum readiness in the way the programme is being developed. On the other hand, there has been a significant reduction in the number of conditions set around Programme admissions. Compared to previous years 2018-19 and 20117-18 where we had 14% and 13%, this year, only 8% of the conditions set were around admissions.
Percentage split by standards area on conditions applied following an approval visit per case
Cancelled visits
This is another area where we have had a very positive outcome. Compared with the last two years, we see a massive drop in the number of visits being cancelled. This is particularly impressive as all cancelled visits were either before the visit or at/after the visit with no visitors’ report produced. What this meant is that we did not have to produce the report only for the provider to then withdraw from the process. We attribute this again to the NPP pathway process and an overall improved relationship with education providers.
Percentage of visits cancelled
| Process stage | 2019-20 | |
| Before the visit | 11 | 69% |
| At the visit or after visit - no visitors report | 5 | 31% |
| After visitors report sent to education provider | 0 | 0% |
Major change process
Major change notifications
We continued to refer less major changes to our approval process for assessment. This is a useful indicator of the nature and extent of changes being made within the training routes for our professions. We can attribute part of the decrease to the pandemic, which has clearly impacted on the level of change providers would normally engage with us about. Our decision to provide flexibility around changes to support student progression also meant providers were not burdened with additional scrutiny for temporary / one-off changes during this challenging time.
Major changes we referred to the approval process
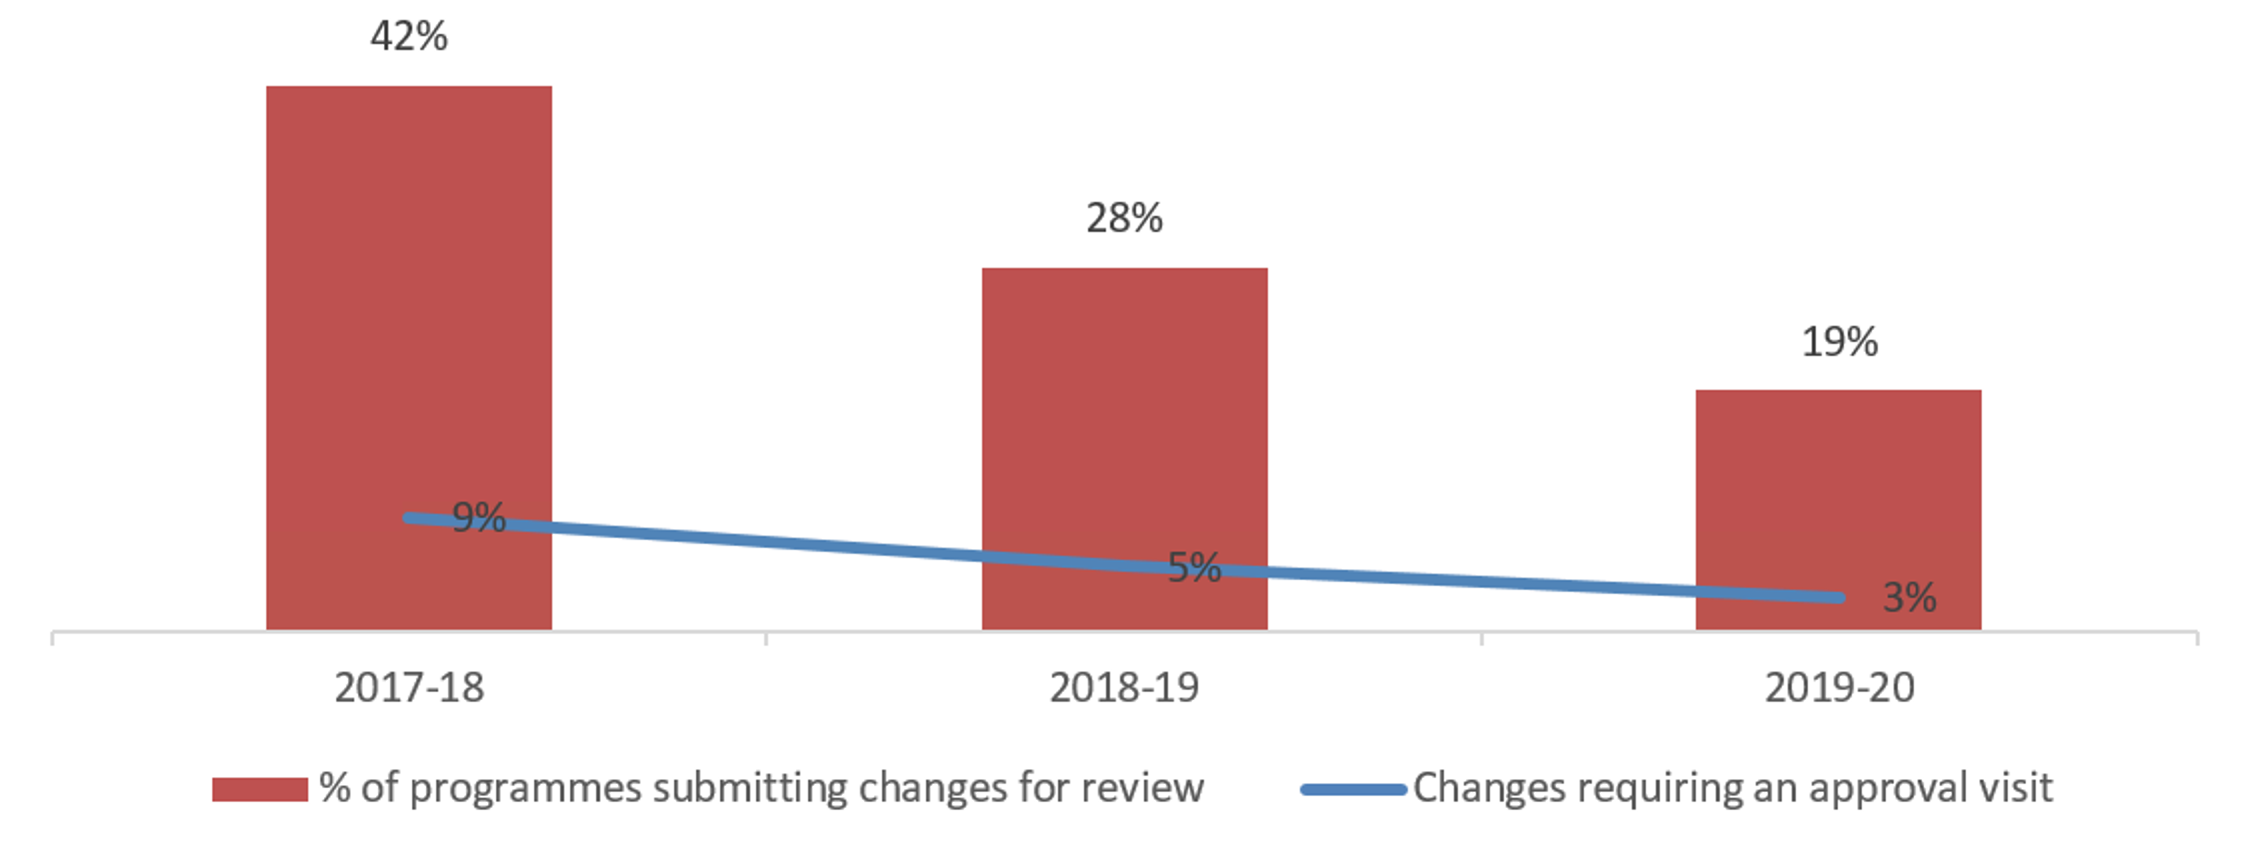
Our different approach to the assessment of degree apprenticeship programmes continues to enable more changes to approved programmes to be considered via this process where it is proportionate to do so. This has enabled us to be more proportionate in our decision making through this process, whilst allowing visitors to continue to scrutinise apprenticeship proposals effectively. We have conducted a review across our apprenticeship work spanning three academic years to focus in on how our approach has led to support the delivery of apprenticeships across our professions.
We referred 97 per cent of all other changes to our major change and annual monitoring processes. In this regard, our open-ended approval approach still seems to be providing a cost-effective way of focusing on the assessment of significant change in a proportionate way.
Executive recommendations made regarding change notifications
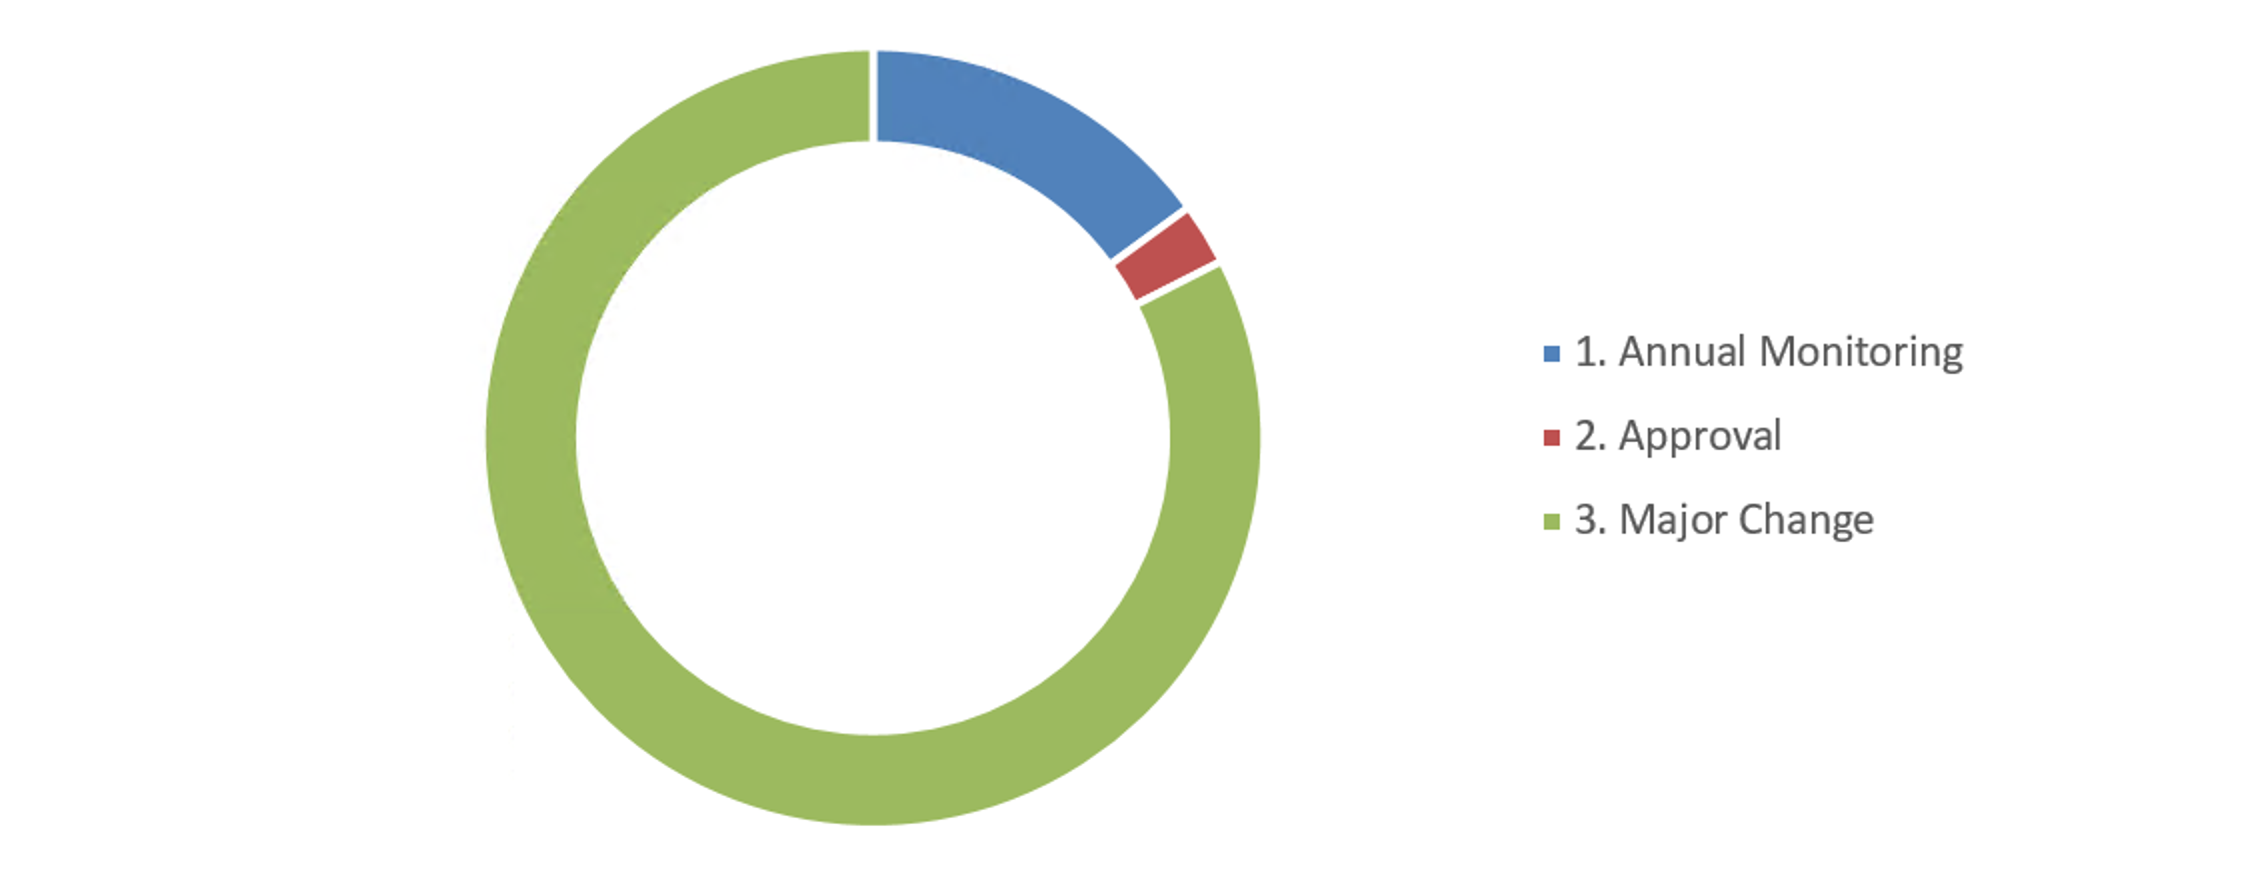
As expected, we processed a reduced number of notifications in this period, with around 9 per cent decrease. This is largely due to social workers leaving.
Top increase / decrease in notifications by profession
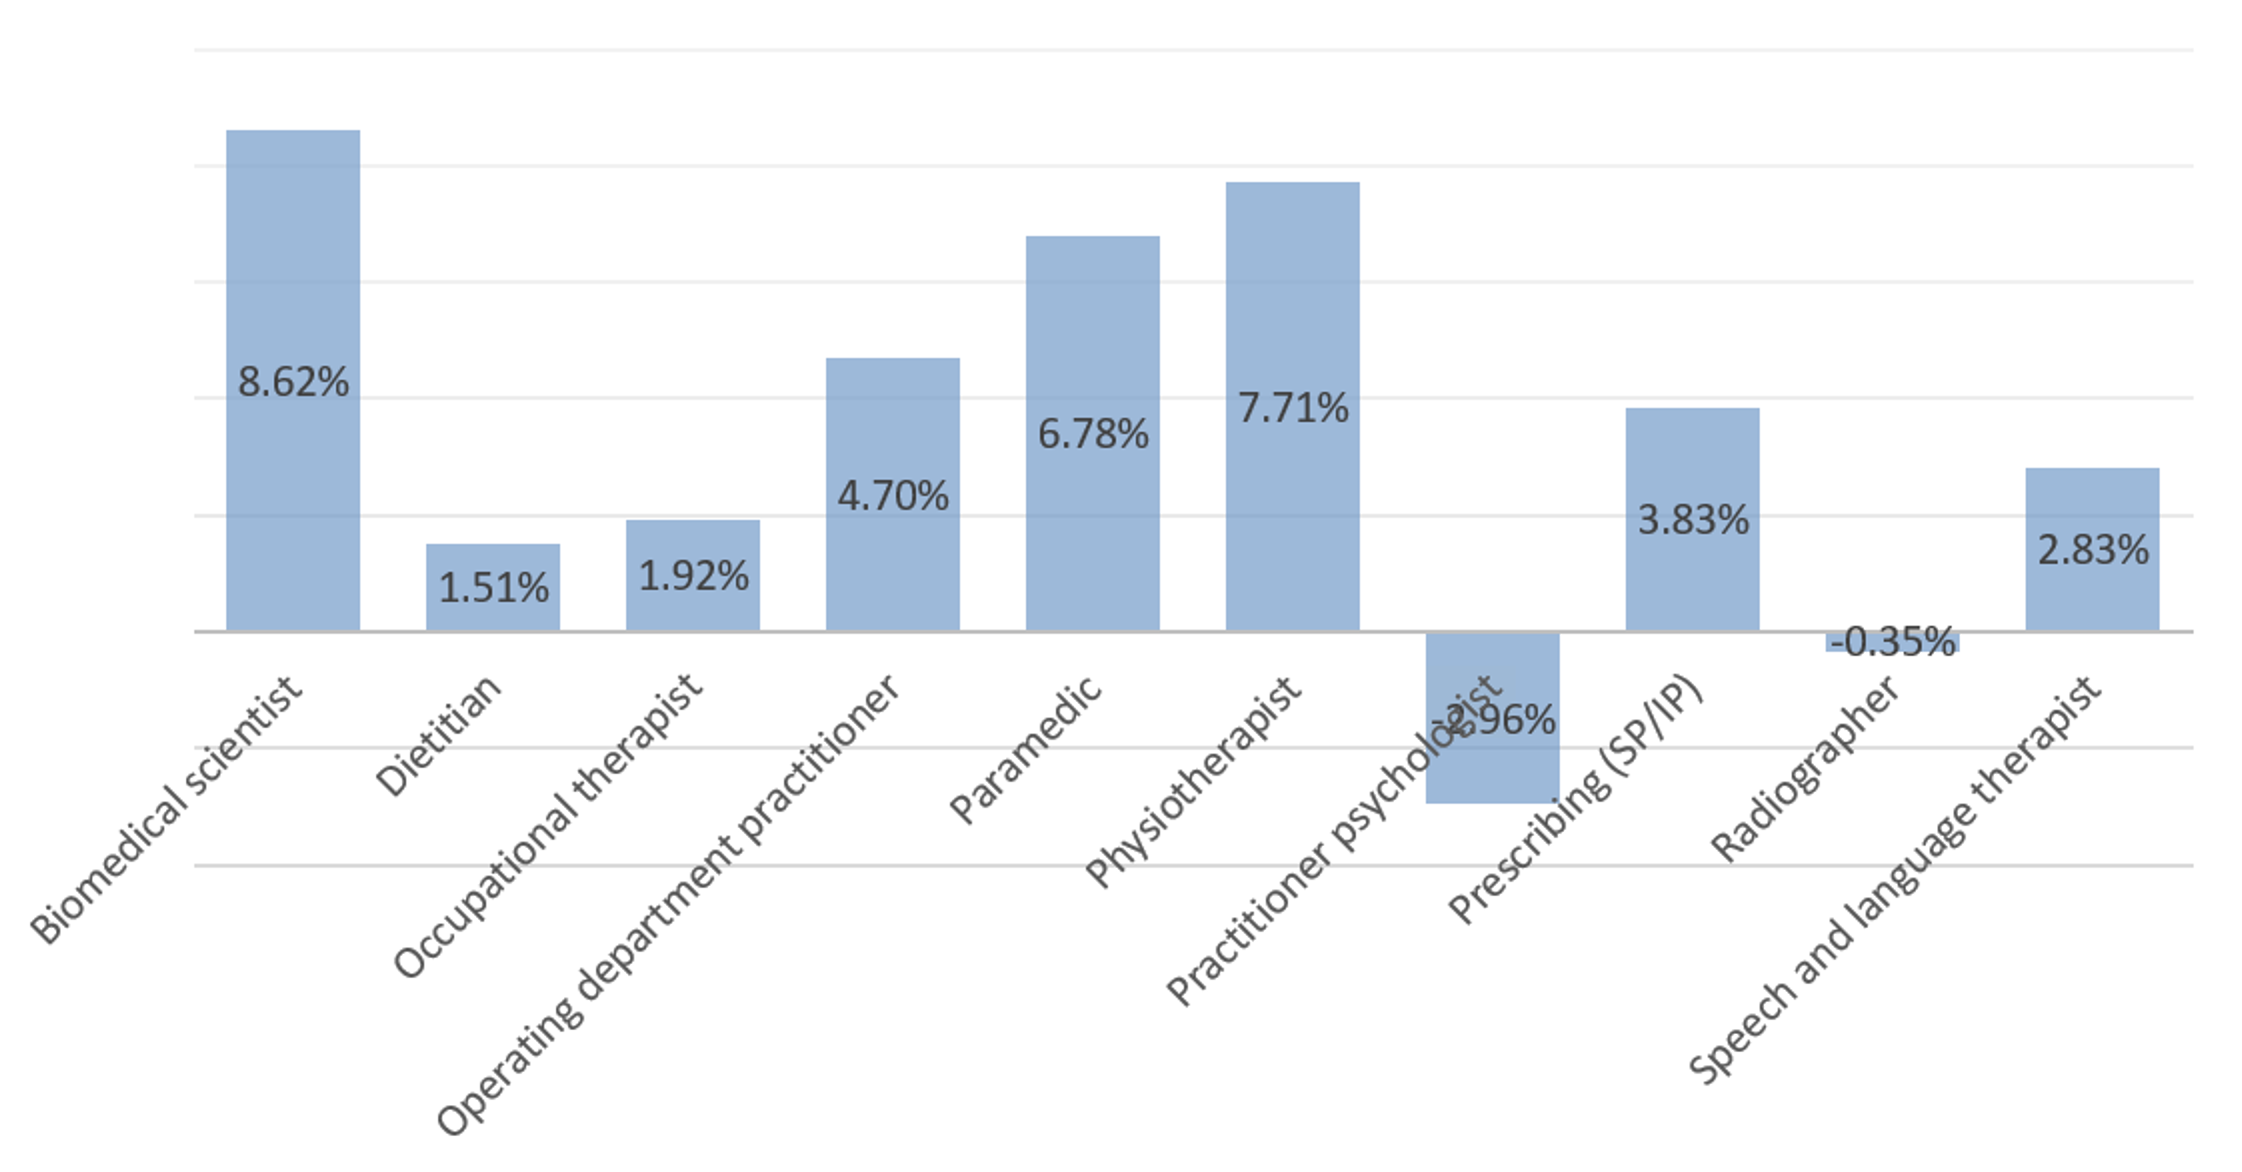
The graph above highlights the profession where we saw the most increases / decreases in change notifications compared cumulatively over the last three years. We have already discussed how trends such as apprenticeships, prescribing rights and workforce challenges have driven engagement through the approvals process. Broadly speaking, these themes can also be applied here.
The Committee should note that major change is only effective where the need to engage with it is well understood by providers. However, as with all our other processes, the new Quality Assurance (QA) model will change how education providers engage with us when they make changes to their programme. The new QA model will allow us the opportunity to communicate further with the sector to increase this understanding, and to reinforce the importance of engagement alongside the benefits of open-ended approval and flexible, output focused standards.
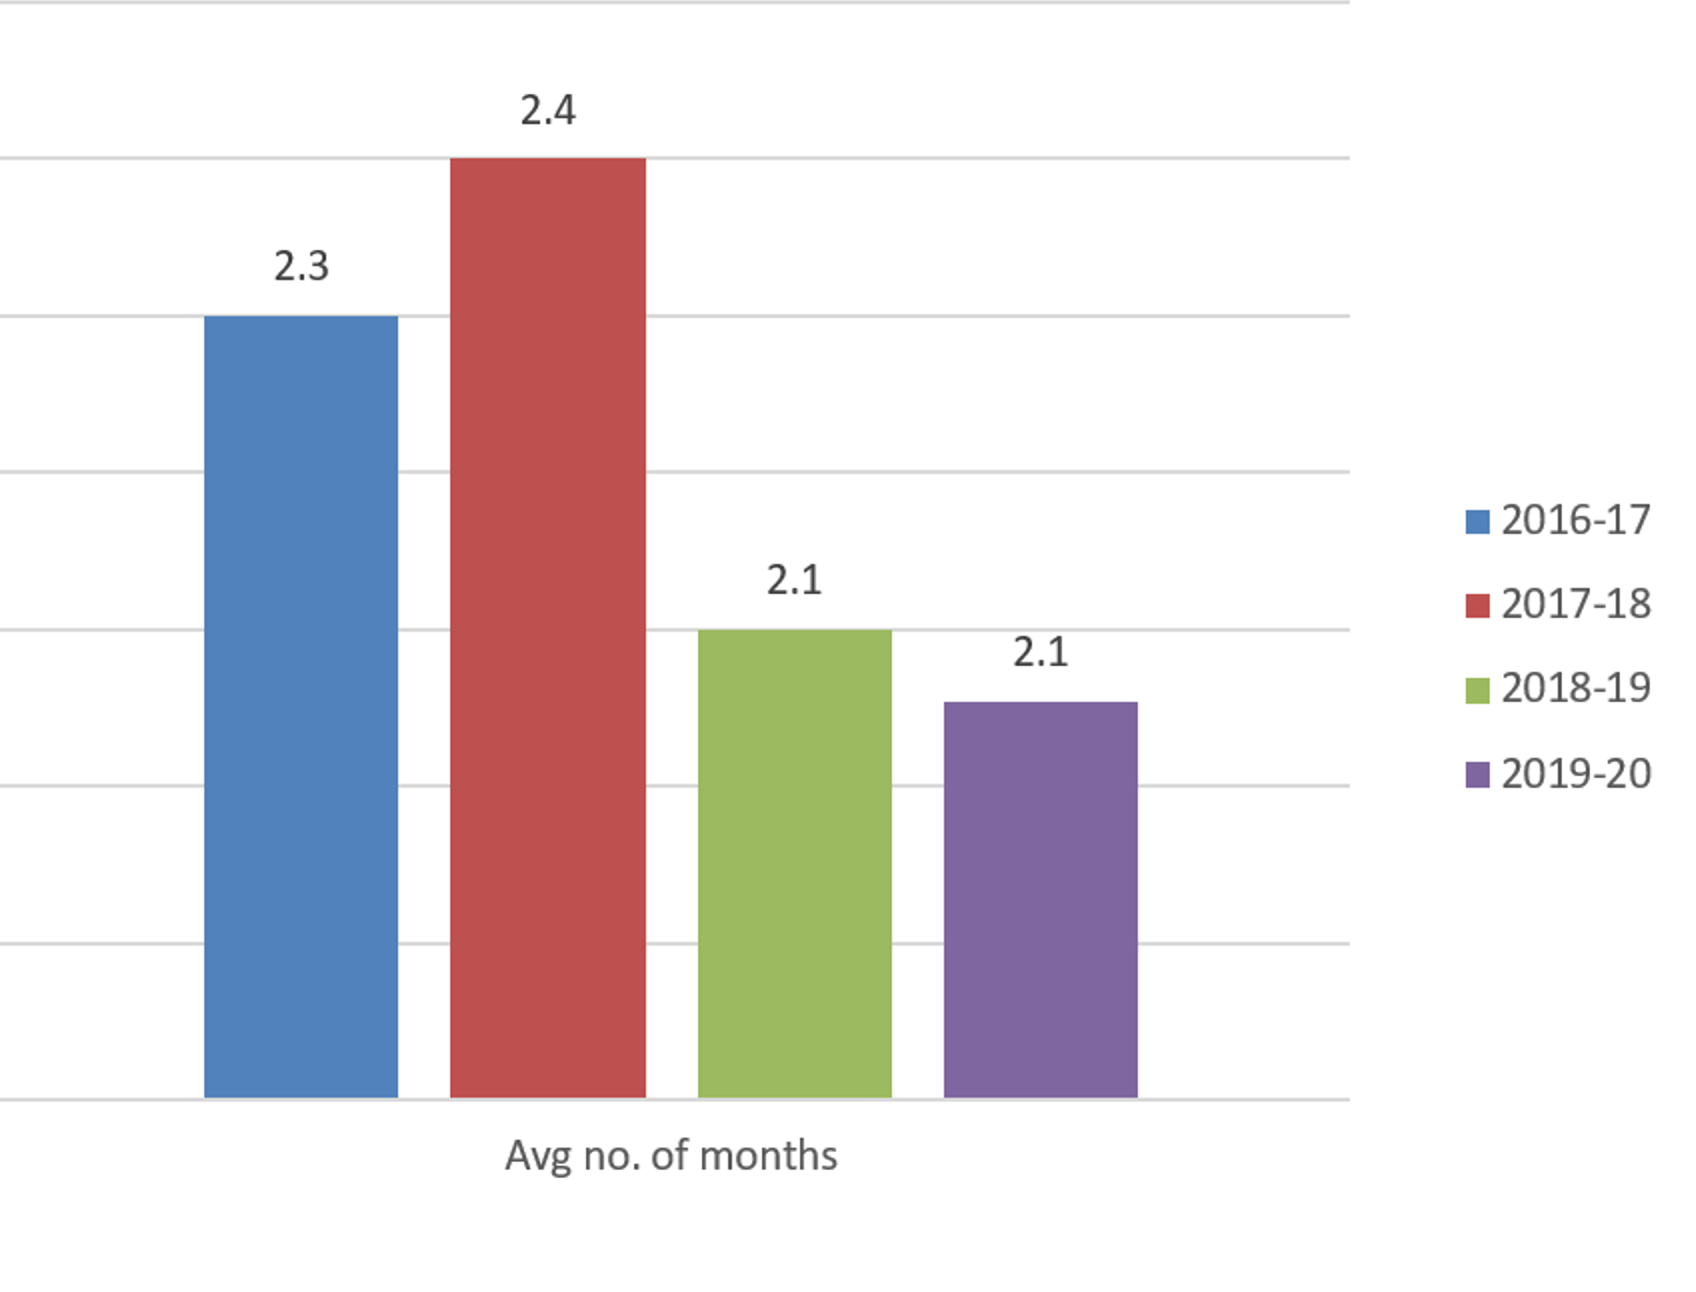
Weeks taken to complete notification and full major change process
| Process stage | 2019-20 | 5 yearly average | Target |
| Notification forms (referred to annual monitoring or approval process) | 2.1 | 2.1 | 2 weeks |
| Complete the full major change process | 11.3 | 10.7 | 12 weeks |
| Notification after 4 months (MC final outcome) | 96% | 91% | 91% |
We went slightly above our notification stage timescale for how long education providers should expect to receive an outcome at 2.1 weeks. However, this is an improvement from last year’s 2.4 weeks and we will continue to monitor this area of the process to understand if further improvements in efficiency can be made. The complexity in changes coupled with increased number of degree apprenticeship approval requests via major change, has necessitated more engagement with education providers to understand the impact to standards and the most proportionate process to use to assess any changes. This remains a likely factor influencing this result.
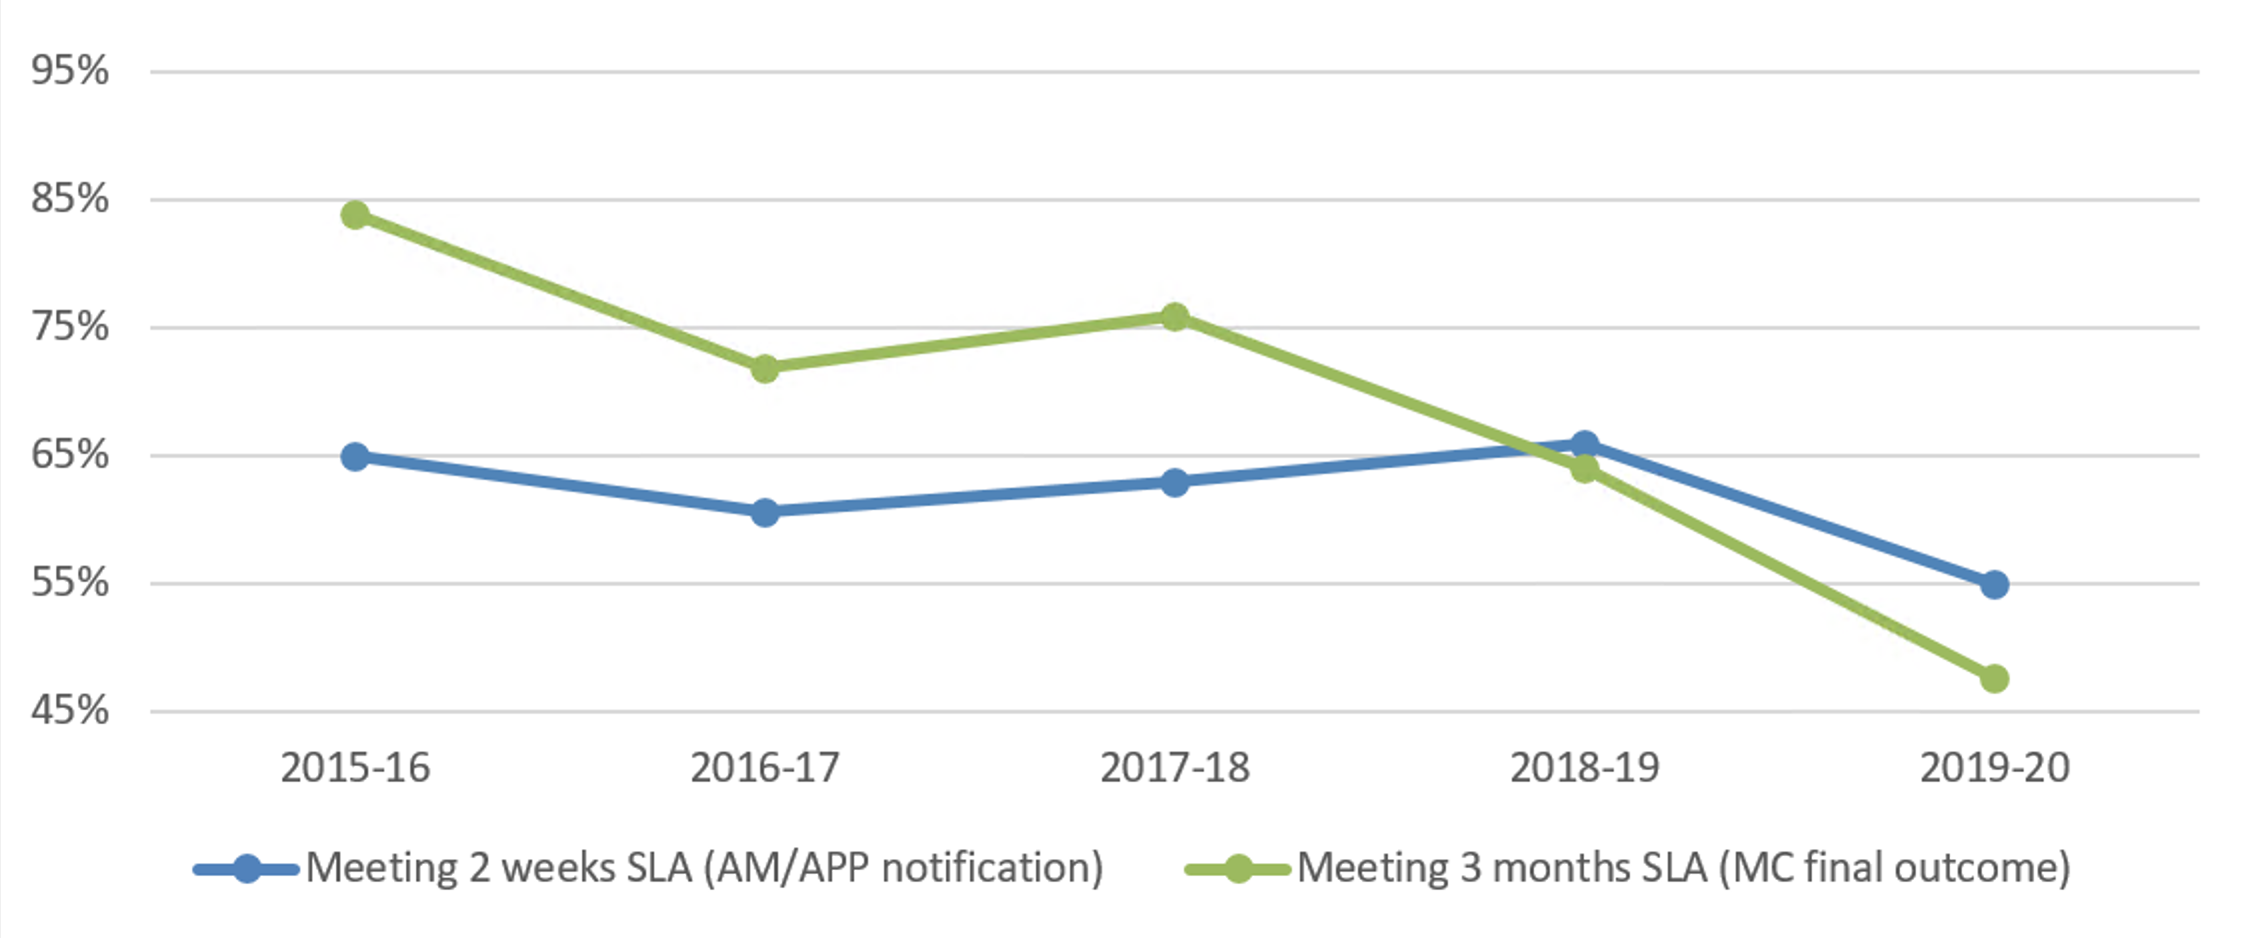
Major change meeting service level agreements over the last five years
| Service levels | 2015-16 | 2016-17 | 2017-18 | 2018-19 | 2019-20 |
| Meeting 2 weeks SLA (AM/APP notification) | 65% | 61% | 63% | 66% | 55% |
| Notification after 3 weeks (AM/APP) | 81% | 83% | 76% | 79% | 81% |
| Meeting 3 months SLA (MC final outcome) | 84% | 72% | 76% | 64% | 48% |
| Notification after 4 months (MC final outcome) | 96% | 91% | 91% | 85% | 62% |
There has been a continuous drop in the percentage of cases meeting the three months service level agreement. This year, only 48 per cent of cases were completed from notification to final outcome in three months. Again, this can be attributed to complexity in changes coupled with increased number of degree apprenticeship approval requests via major change. In many of such cases, we have had to request additional evidence to assess the changes and this has prolonged the assessment time.
Annual monitoring process
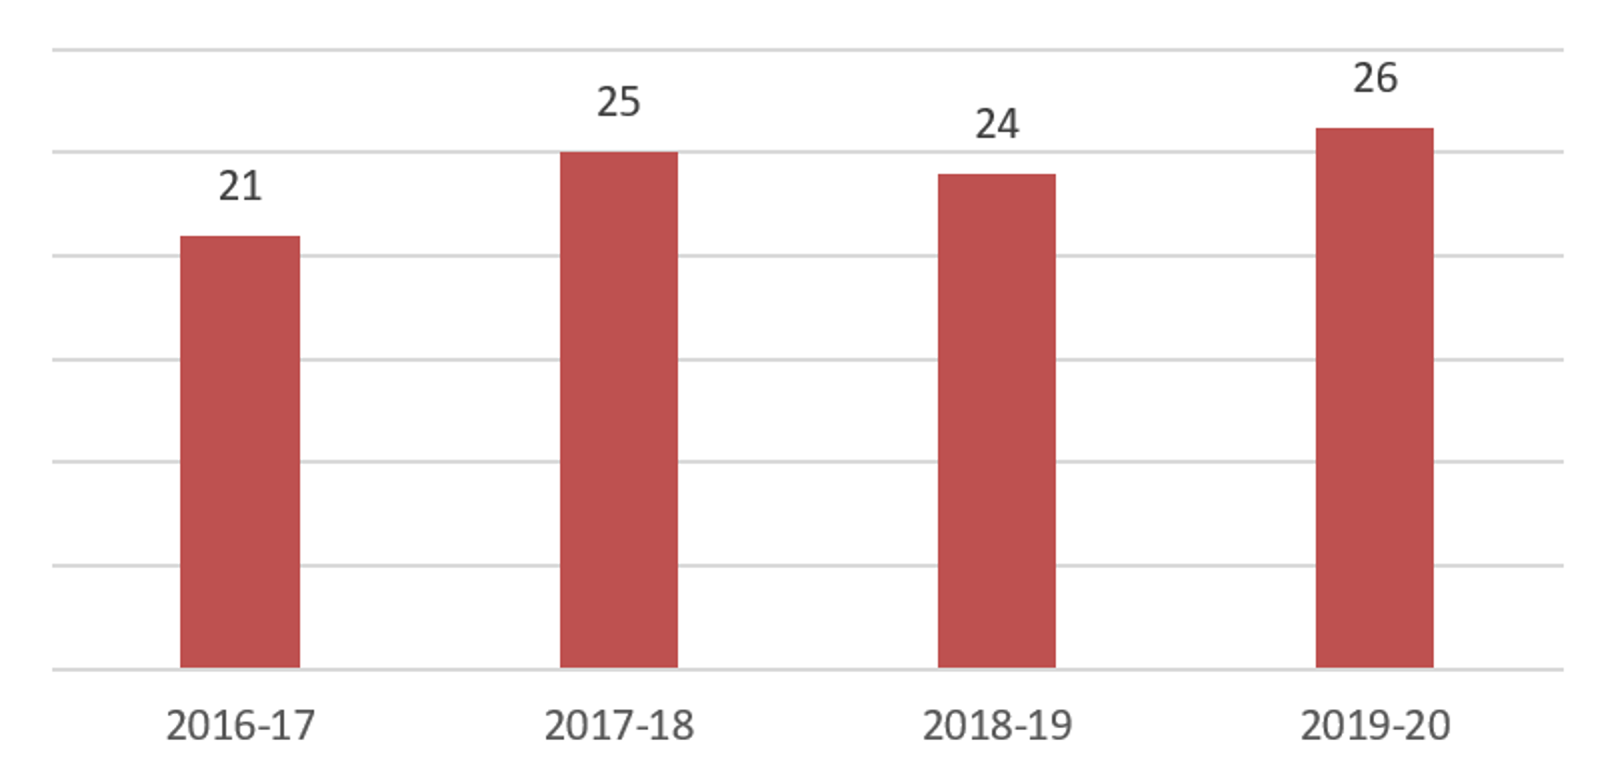
Number of programmes we monitored
Total number of programmes monitored
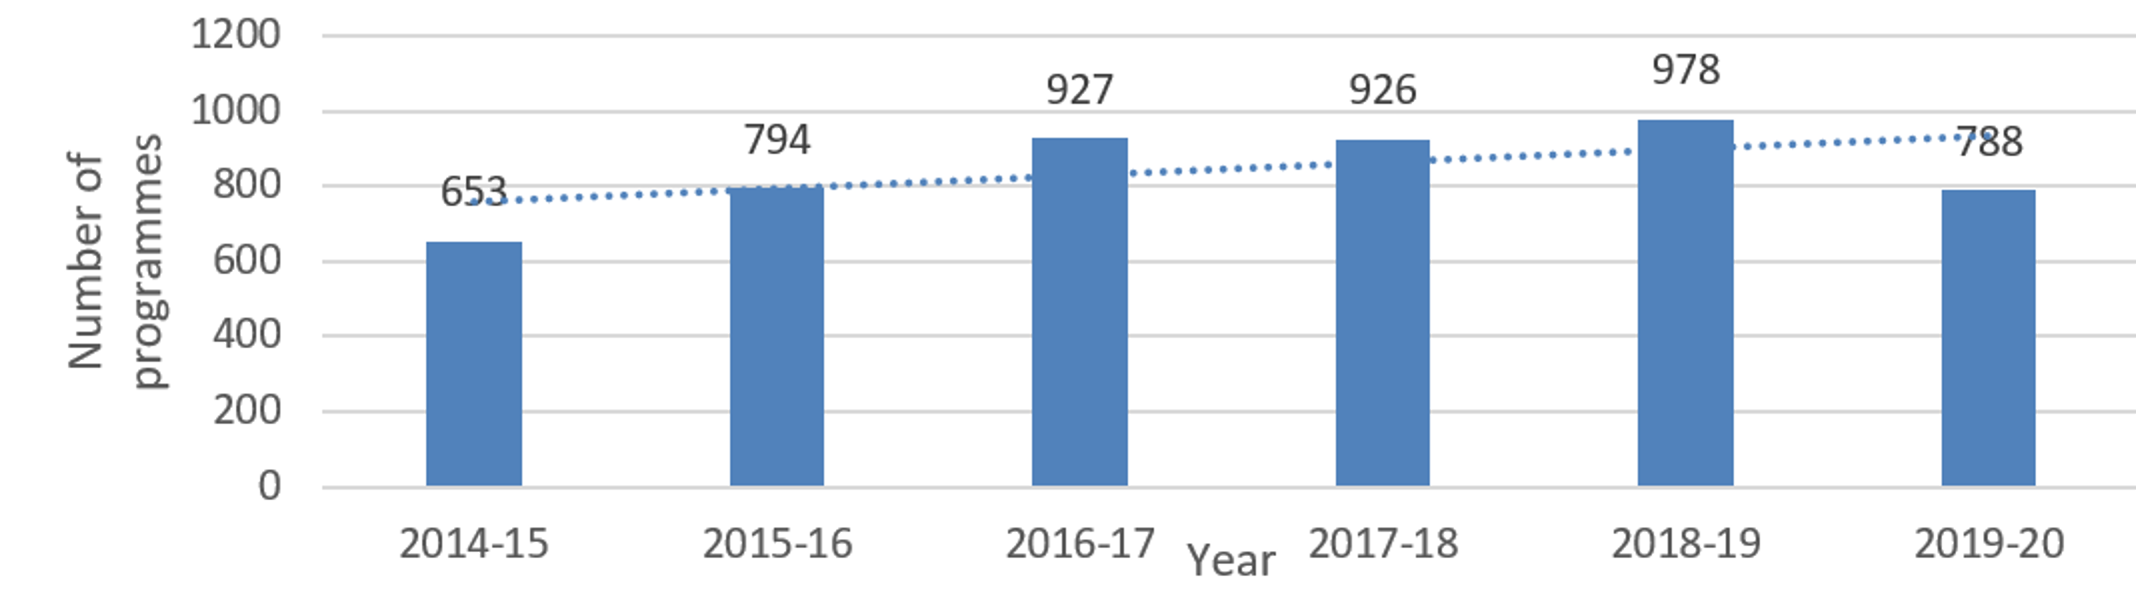
As with other processes where numbers have fallen as a result of the transfer of social workers, the overall number of programmes monitored in the 2019-20 academic year has decreased compared to the last four years. However, as we continue to see a steady increase in the number of approved programmes, we can expect this to impact on monitoring in the coming years, in line with the new QA model.
When we require additional documentation to be submitted
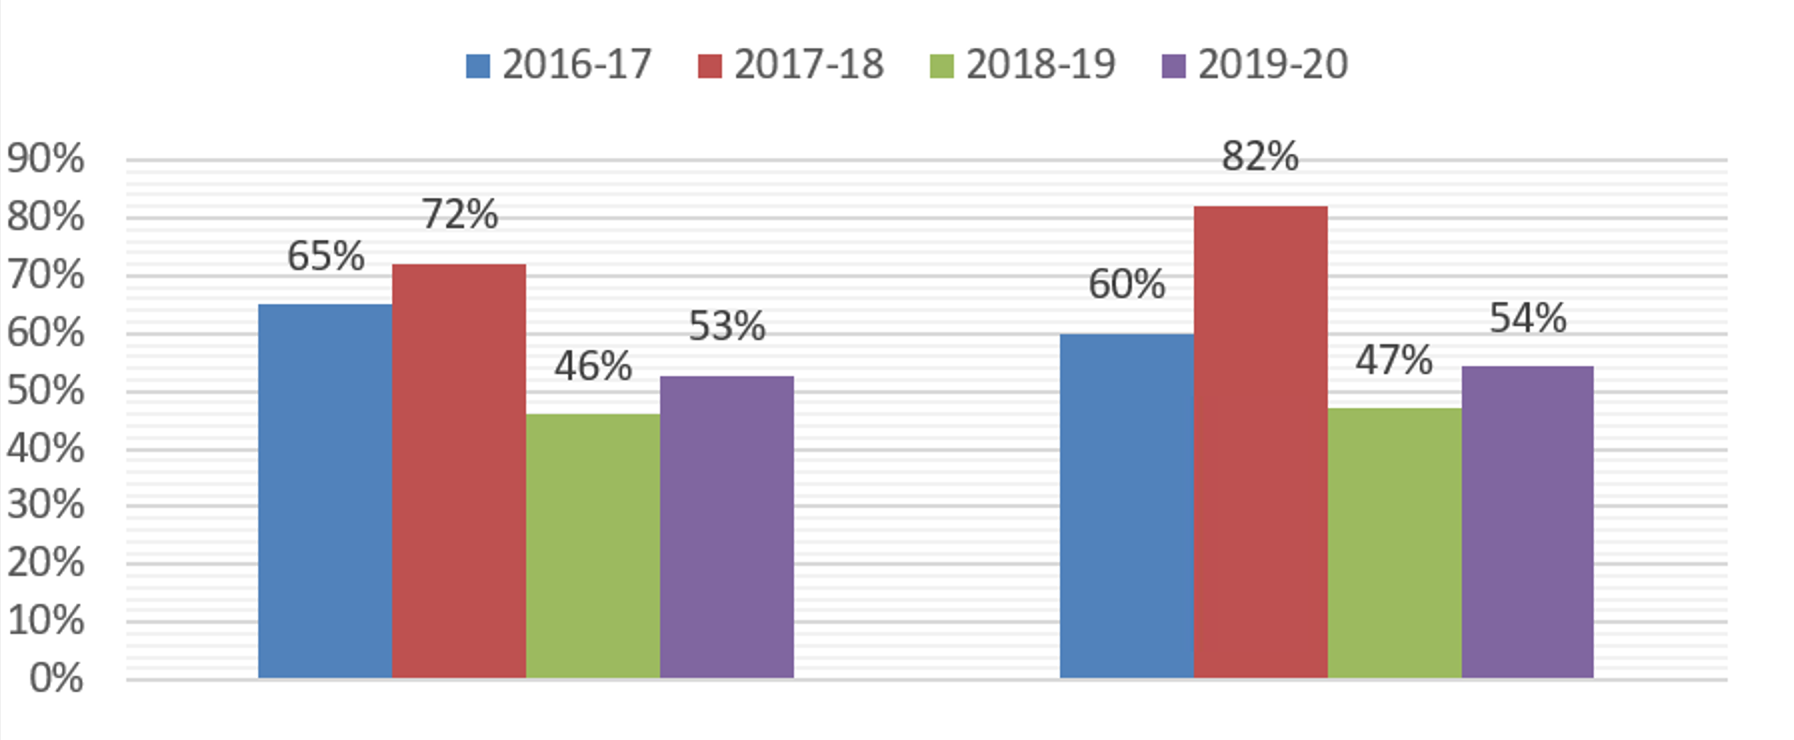
Over the past four years, we have worked to address a disparity in outcomes within this annual monitoring process based on our method of assessment: assessment day versus postal assessment. We have now managed to achieve consistency in this area in the last couple of years, following further training and guidance for both executives and visitors, and more effective back office systems to manage this process. This has been achieved in the context of assessing the revised education standards, and expanding the evidence base to include practice based learning and service user and carer monitoring information.
There is still a lower proportion of programmes meeting our standards at their first attempt this year, although there is an 8 per cent increase from last year’s figures. We have continued to provide education providers with targeted information on our website and through webinars. We would expect these results to change following the introduction of the new QA model. Through online refresher sessions, we will ensure all visitors are kept up to date with changes. And we will continue communication activities as we look to increase the number of providers meeting our requirements at the first attempt as a result.
Average time taken to consider audits, compared to previous years
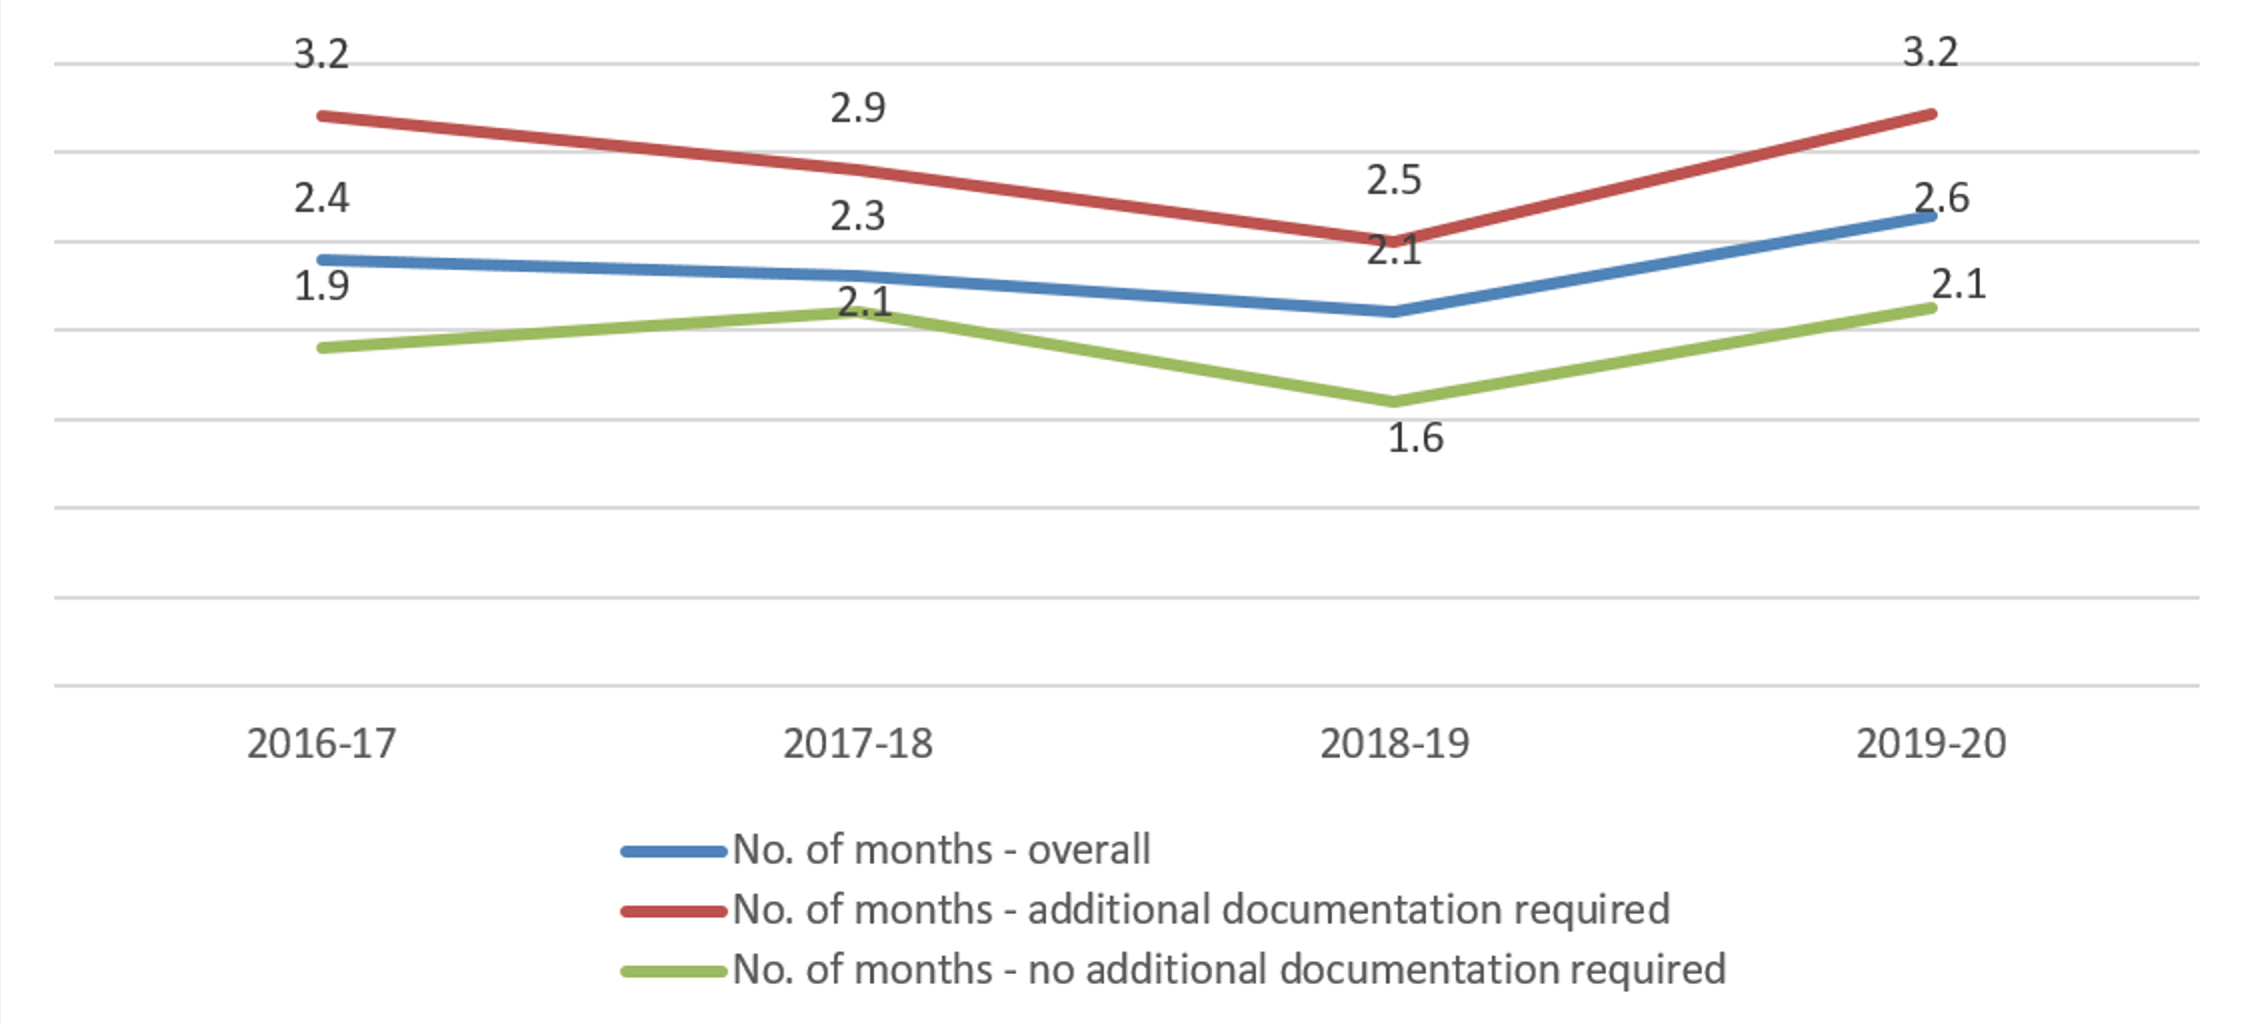
This year, we see an increase in the number of months taken to consider audits when compared to previous years. The Committee should note that although 2 per cent of programmes audited this year were referred to the approval process for further assessment, again this figure relates to the same single case where seven programmes were considered unmet by the end of the audit process.
Programme concerns process
Concerns received per year
| Year | No of programmes | % of all approved programmes |
| 2015-16 | 6 | 0.6% |
| 2016-17 | 9 | 0.8% |
| 2107-18 | 10 | 0.9% |
| 2018-19 | 8 | 0.7% |
| 2019-20 | 6 | 1.0% |
The number of programmes subject to a concern being raised and investigated continue to remain low (not more than 1 per cent).
Whilst this is the case, it is worth noting the process itself once started appears to be effective in allowing for a range of outcomes to be reached. In this period we investigated three concerns fully, all of which required no further action. A fourth concern is still being investigated. Our change in approach to seek to resolve quality assurance issues within the concerns process itself, rather than referring to another process continues to be effective.
- Published:
- 31/03/2020
- Resources
- Report, Data
- Subcategory:
- Education data